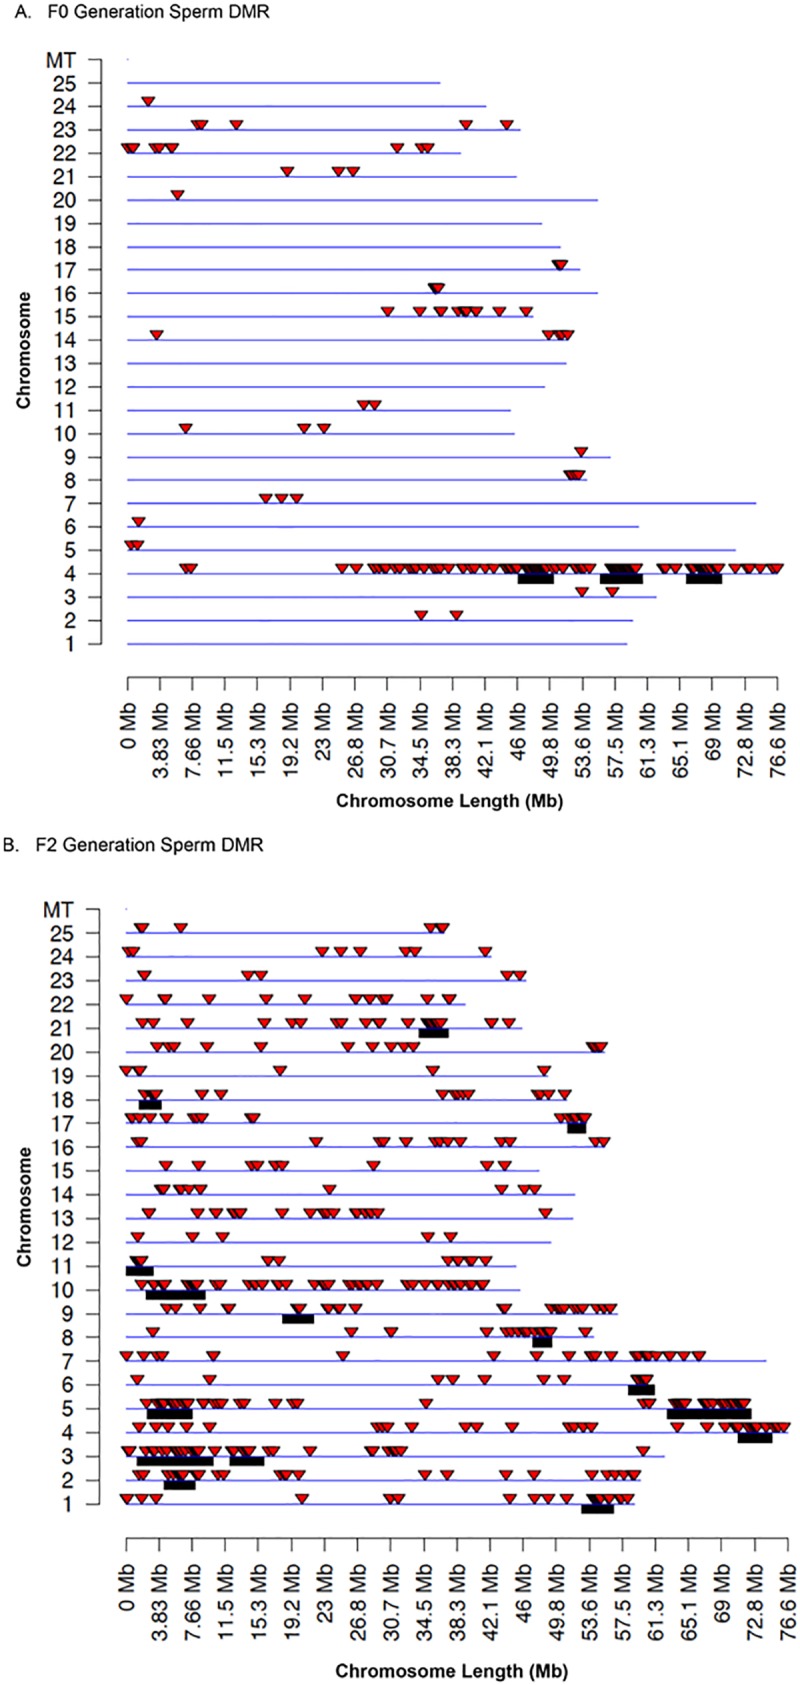
Fig 3. DMR chromosomal locations.

(A) The F0 generation sperm DMR locations on the individual chromosomes. Only multiple window DMRs at a p-value threshold of 1e-07 are shown here. (B) The F2 generation sperm DMR locations on the individual chromosomes. Only multiple window DMRs at a p-value threshold of 1e-07 are shown here. The red arrowhead identifies the location of the DMR and black box identifies the DMR cluster site.
