
Fig. 5.
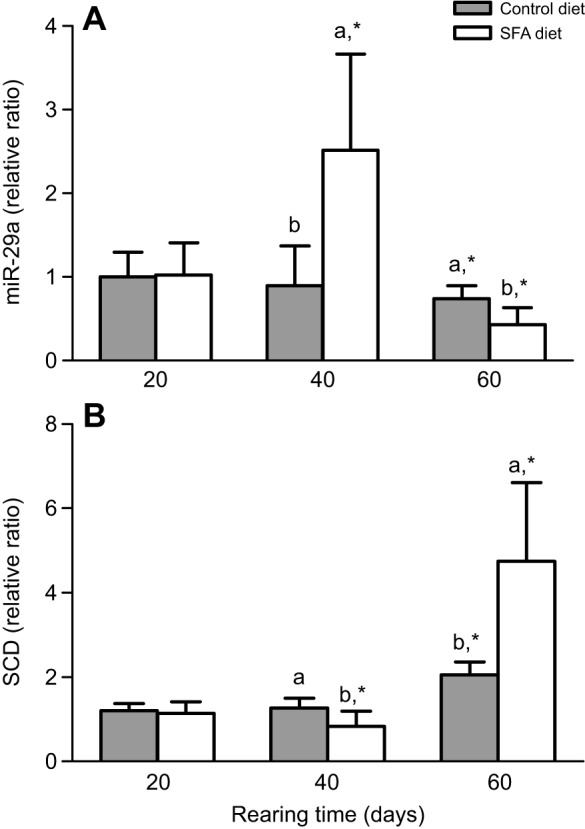
miR-29a and SCD expression in response to different lipid sources (n=9 replicates per group). GIFT were fed SFA or control diets. (A) The expression of miR-29a in liver was detected on days 20, 40 and 60 using qRT-PCR, with U6 as the reference gene. (B) The expression of SCD in liver was detected on days 20, 40 and 60 using qRT-PCR, with 18S rRNA as the reference gene. The group exposed to control diets on day 20 was taken as the control group. The data were expressed as the relative change compared with the control group on day 20. Asterisks indicate significant differences (*P<0.05 paired-sample t-test) in each group among sampling points. Different superscript letters indicate significant differences (P<0.05) in different groups at each sampling point with Duncan's multiple range test.