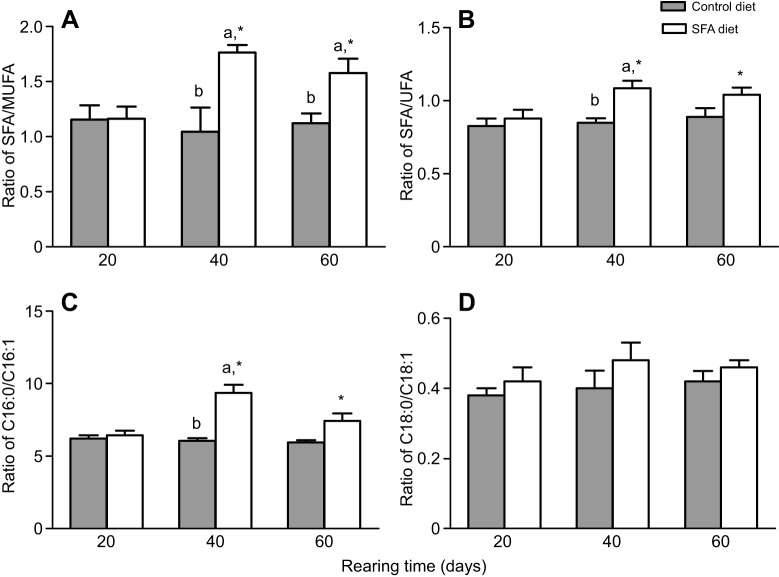
Fig. 6.
Fatty acid ratios of GIFT tilapia in response to SFA or control diets on days 20, 40 and 60. (A) SFA/MUFA, (B) SFA/UFA, (C) C16:0/C16:1 and (D) C18:0/C18:1. Asterisks indicate significant differences (*P<0.05 paired-sample t-test) in each group among sampling points. Different superscript letters indicate significant differences (P<0.05) in different groups at each sampling point with Duncan's multiple range test.

