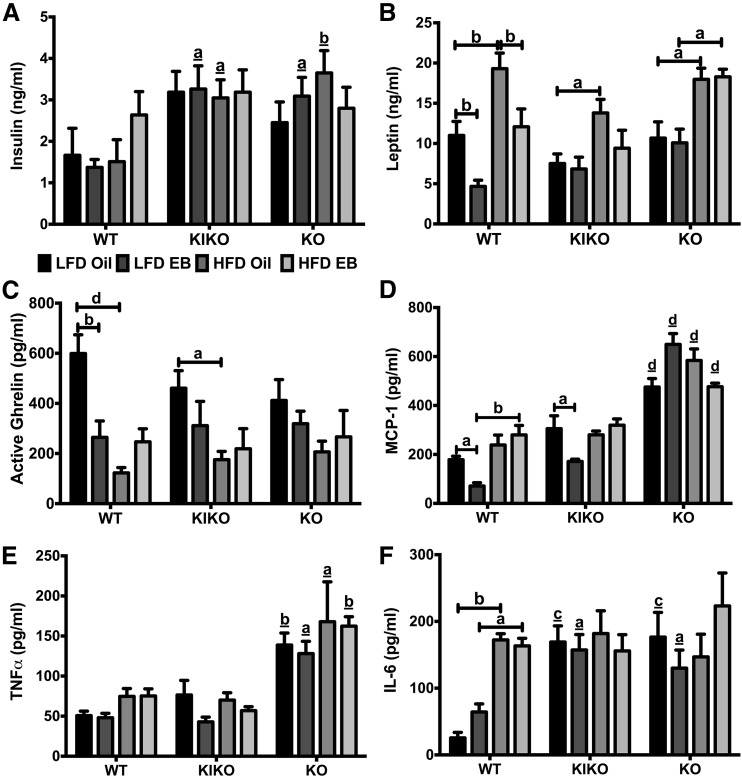
Figure 5.
Regulation of peripheral peptide hormones and inflammatory cytokines by EB and HFD. (A) Plasma insulin levels (ng/mL). (B) Plasma leptin levels (ng/mL). (C) Plasma ghrelin levels (pg/mL). (D) Plasma MCP-1 levels (pg/mL). (E) Plasma TNF-α levels (pg/mL). (F) Plasma IL-6 levels (pg/mL). Data were analyzed by a multifactorial ANOVA with post hoc Newman-Keuls test. Sample sizes were 9 to 10 per group. Capped lines denote comparisons within genotype between steroid (oil vs EB) and diet (LFD vs HFD) combinations, and underlined letters denote comparisons between WT and either KIKO or KO within the same treatment combination (a, P < 0.05; b, P < 0.01; c, P < 0.001; d, P < 0.0001).

