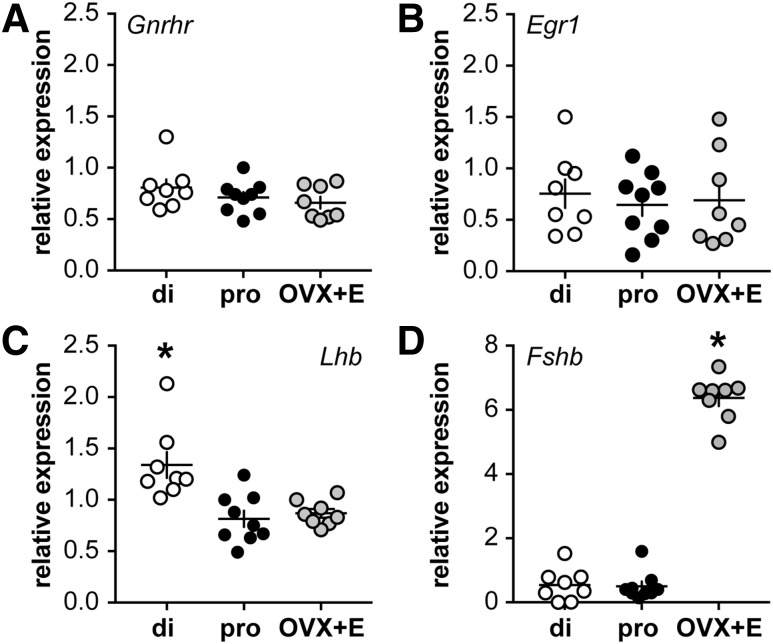
Figure 5.
Relative steady-state mRNA levels of selected pituitary genes, normalized to mean expression of Actin and Ppia. (A) Gnrhr, (B) Egr1, (C) Lhb, and (D) Fshb in pituitaries from diestrous (open circles), proestrous (black circles), and OVX+E (gray circles) mice. Each symbol represents 1 mouse; the horizontal and vertical lines show mean ± standard error of mean, respectively. Note change in scale of y-axis in panel D. *P < 0.05 calculated by 1-way ANOVA/Tukey or Kruskal-Wallis/Dunn. di, diestrous; pro, proestrous.

