Figure 2.
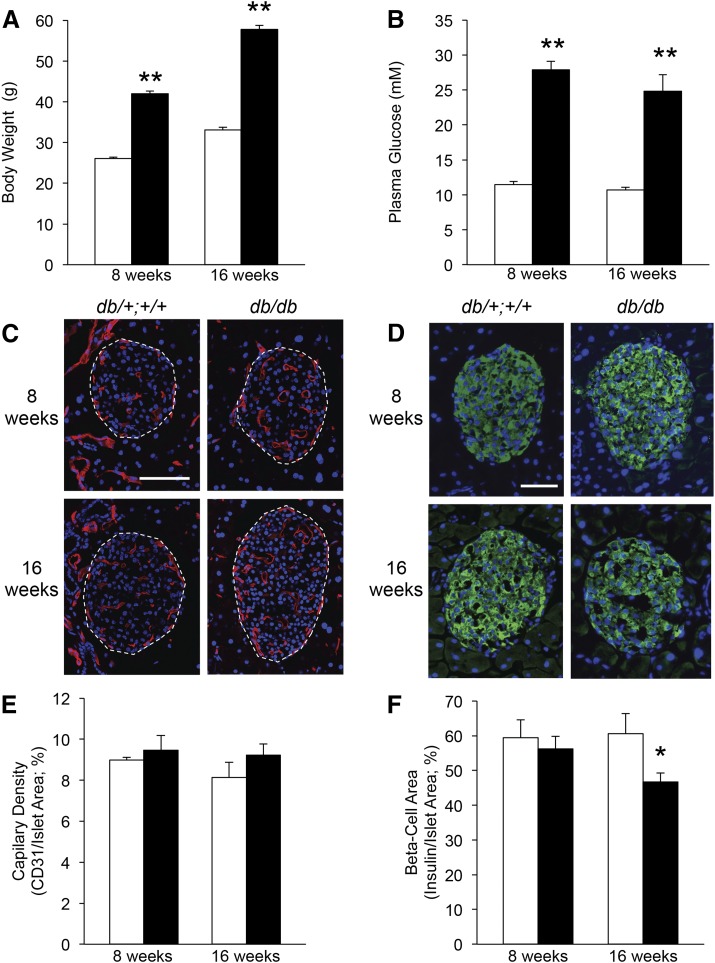
Diabetic db/db (solid bars) and nondiabetic littermate db/+;+/+ mice (open bars) were studied at 8 and 16 weeks of age for body weight (A) and nonfasting plasma glucose levels (B). Representative micrographs show islet CD31- (red; C; islet outlines denoted by dashed lines) or insulin immunoreactivity (green; D) and nuclear counterstaining (blue; C, D). Islet capillary density was quantified as the percentage of CD31-positive islet area (E), and β-cell area was quantified as the percentage of insulin-positive islet area (F); n = 10 to 16 for body weight and glucose; n = 4 to 7 for histologic measures; *P < 0.05 and **P < 0.001 vs age-matched db/+;+/+ control. Scale bar = 100 µm (C) and 50 µm (D).

