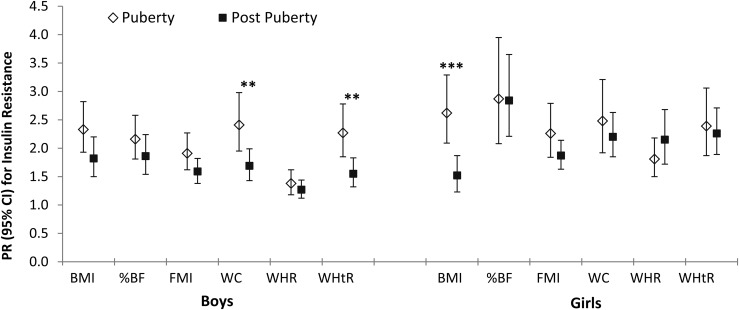
Figure 2.
Prevalence ratios (95% CIs) for insulin resistance with 1 SD increment in adiposity measures by sex and pubertal status. Adiposity measures are transformed to age-adjusted, sex-specific z scores. Models adjusted for Hispanic/Latino background, field center, nativity, parental education level, annual family income, and self-reported physical activity. Prepubertal children (Tanner stage 1) were excluded owing to small sample size (n ≤ 50). Subjects missing Tanner staging were also excluded. **P < 0.01 for interaction between puberty development and adiposity measures on insulin resistance in boys. ***P < 0.001 for interaction between puberty development and adiposity measures on insulin resistance in girls.

