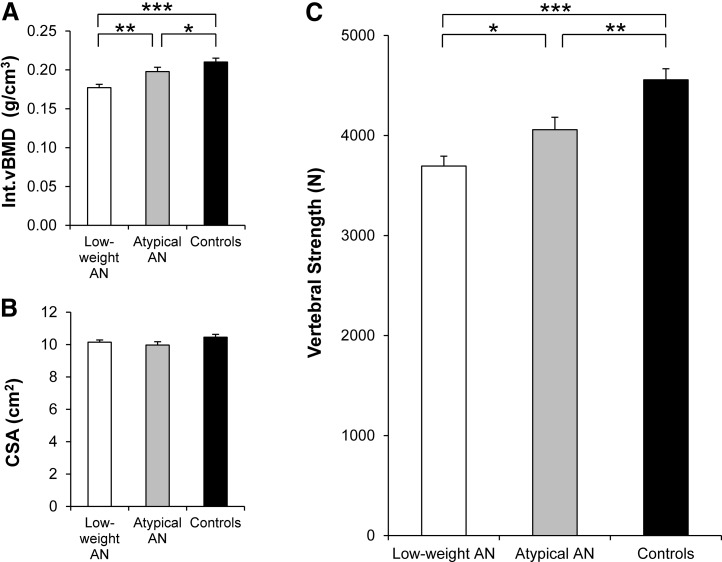
Figure 1.
Int.vBMD, CSA, and vertebral strength in low-weight AN, atypical AN, and controls. (A) Int.vBMD was lowest in low-weight AN, highest in controls, and intermediate in atypical AN. (B) CSA did not differ between the 3 groups. (C) Vertebral strength was lowest in low-weight AN, highest in controls, and intermediate in atypical AN. Results are reported as means ±standard error of the mean. *P < 0.05; **P < 0.01; ***P < 0.0001.

