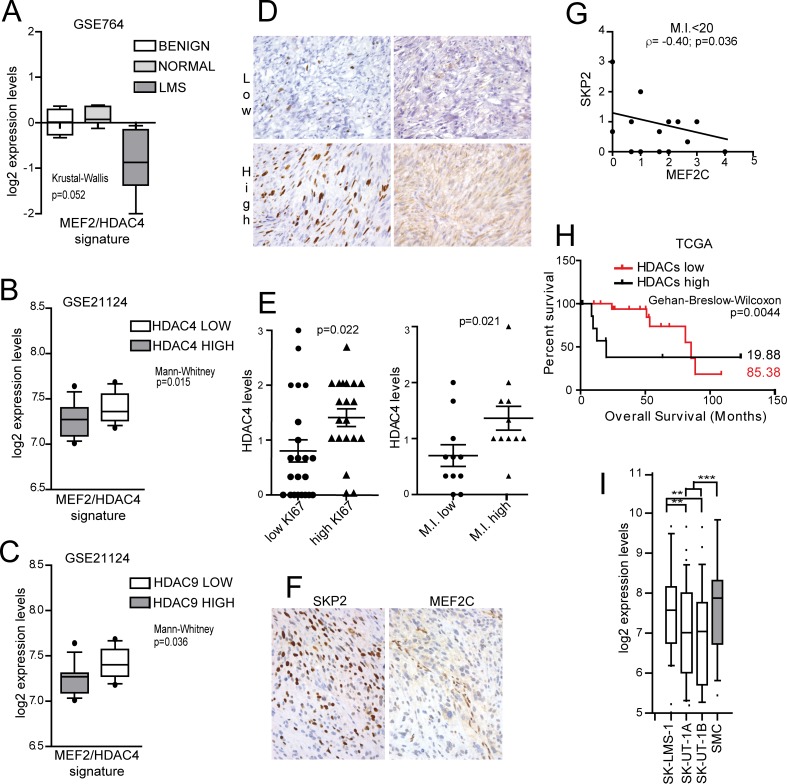
Fig 1. Analysis of MEF2 signature, HDAC4, SKP2 and MEF2C expression levels in leiomyosarcomas.
A) Turkey box-plots illustrating the mRNA expression levels (GSE764) of MEF2-target genes in normal uterus, benign leiomyomas and malignant leiomyosarcomas. The latter are characterized by a significant (Kruskal-Wallis p<0.1) repression of MEF2 targets. B-C) The mRNA expression levels of the MEF2 targets in malignant leiomyosarcoma (GSE21124) were clustered in two sub-groups according to the expression levels of well-known MEF2 repressors (HDAC4, HDAC5, HDAC7, HDAC9, CABIN1). Only in the case of HDAC4 and HDAC9 a higher expression is significantly correlated to a decrease in the expression of MEF2 targets, as depicted in the Turkey box-plots. Mann-Whitney p< 0.05. D) Top pictures representing a case of uterine LMS with low Ki67 and weak and focal HDAC4 cytoplasmic expression; bottom pictures representing a case of uterine LMS with high Ki67 and diffuse cytoplasmic expression of HDAC4. E) IHC analysis of HDAC4 protein levels in LMS samples, clustered into two groups according to Ki67 positivity (1st quartile = low; 3rd quartile = high) (left) and M.I. (1st quartile = low; 3rd quartile = high) (right). Mann-Whitney p< 0.05. n = 22. F) A case of uterine LMS with nuclear expression of SKP2 in the majority of the cells and weak and focal cytoplasmic expression of MEF2C. Nuclear expression of MEF2C is present in non-neoplastic endothelial cells. Quantitative data are presented in S2 Table. G) Correlations between SKP2 and MEF2C protein levels in LMS samples, characterized by a M.I.<20. n = 20. R2 = 0.3. H) Kaplan-Meier survival analysis related to the expression levels of class IIa HDACs in TCGA LMS samples. From all cases (n = 106), the ones characterized by high levels of MEF2s (above the third quartile, n = 26) were analysed and clustered into two groups according to class IIa HDAC expression levels (high levels = above the third quartile, n = 8); Wilcoxon p<0.05. I) Turkey box-plots illustrating the mRNA expression levels (GSE39262) of MEF2 target genes in LMS cell lines (filled in white) compared to the normal smooth muscle cells (filled in gray). Anova p<0.05, Turkey p<0.05. * p < 0.05, ** p < 0.01, *** p < 0.001

