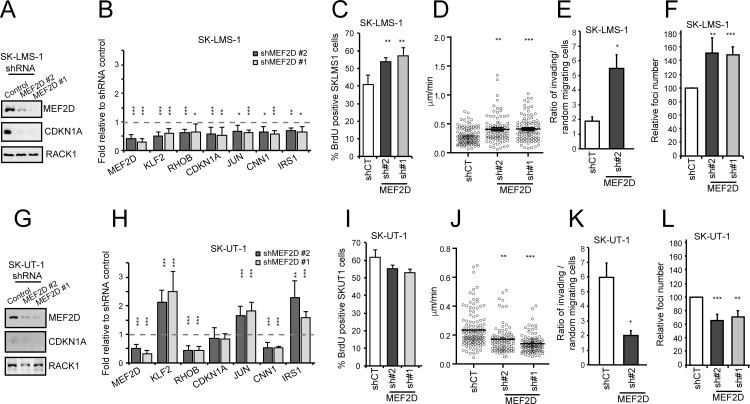
Fig 3. MEF2D silencing causes opposite effect in SK-LMS-1 and SK-UT-1 cells.
A) MEF2D expression was silenced by lentiviral infection using two different shRNAs. Immunoblot analysis of MEF2D and CDKN1A levels in SK-LMS-1 cells expressing the control shRNA or two different shRNAs against MEF2D. RACK1 was used as loading control. B) qRT-PCR analysis of mRNA expression levels of MEF2D and of some MEF2-target genes (KLF2, RHOB, CDKN1A, JUN, CNN1, IRS1) in SK-LMS-1 cells expressing the different shRNAs. mRNA levels are relative to control shRNA. Data are presented as mean ± SD; n = 4. C) Analysis of the cells synthetizing DNA as scored after BrdU staining. Mean ± SD; n = 3. D) SK-LMS-1 cells expressing the indicated shRNAs were seeded at 2x10⁴/ml in plates coated with 10μg/ml fibronectin, or BSA; after 16h they were subjected to time-lapse analysis for 6 hours. Results represent the individual migration rate and the average (bar) from at least 140 cells from three independent experiments. Mean and SEM are indicated. E) Invasion properties of the SK-LMS-1 cells expressing the shRNA2 against MEF2D or the control. Data are presented as mean ± SD; n = 4. Invasion of the Matrigel was scored after 16 hours and was expressed as ratio between cells invading the matrix in presence (oriented motility) and absence (random invasion) of the chemoattractant. Cells were evidenced with Hoechst 33342 staining. At least 5 fields for each condition were acquired and the invading cells were counted by using ImageJ. F) Growth in soft agar of SK-LMS-1 cells expressing the indicated shRNAs, foci were stained with MTT and counted. Data are presented as mean ± SD; n = 4. G) MEF2D expression was silenced by lentiviral infection using two different shRNAs. Immunoblot analysis of MEF2D and CDKN1A levels in SK-UT-1 cells expressing the control shRNA or two different shRNAs against MEF2D. RACK1 was used as loading control. H) qRT-PCR analysis of mRNA expression levels of MEF2D and of some MEF2-target genes (KLF2, RHOB, CDKN1A, JUN, CNN1, IRS1) in SK-UT-1 cells expressing the different shRNAs. mRNA levels are relative to control shRNA. Data are presented as mean ± SD; n = 4. I) Analysis of the cells synthetizing DNA as scored after BrdU staining. Mean ± SD; n = 3. J) SK-UT-1 cells expressing the indicated shRNAs were subjected to time-lapse analysis for 6 hours as in Fig 3D. Results represent the individual migration rate and the average (bar) from at least 140 cells from three independent experiments. Mean and SEM are indicated. K) Invasion properties of the SK-UT-1 cells expressing the shRNA2 against MEF2D or the control. Data are presented as mean ± SD; n = 4. Invasion of the Matrigel was scored after 16 hours and was expressed as ratio between cells invading the matrix in presence (oriented motility) and absence (random invasion) of the chemoattractant. Cells were evidenced with Hoechst 33342 staining. At least 5 fields for each condition were acquired and the invading cells were counted by using ImageJ. L) Growth in soft agar of SK-UT-1 cells expressing the indicated shRNAs, foci were stained with MTT and counted. Data are presented as mean ± SD; n = 4. * p < 0.05, ** p < 0.01, *** p < 0.001

