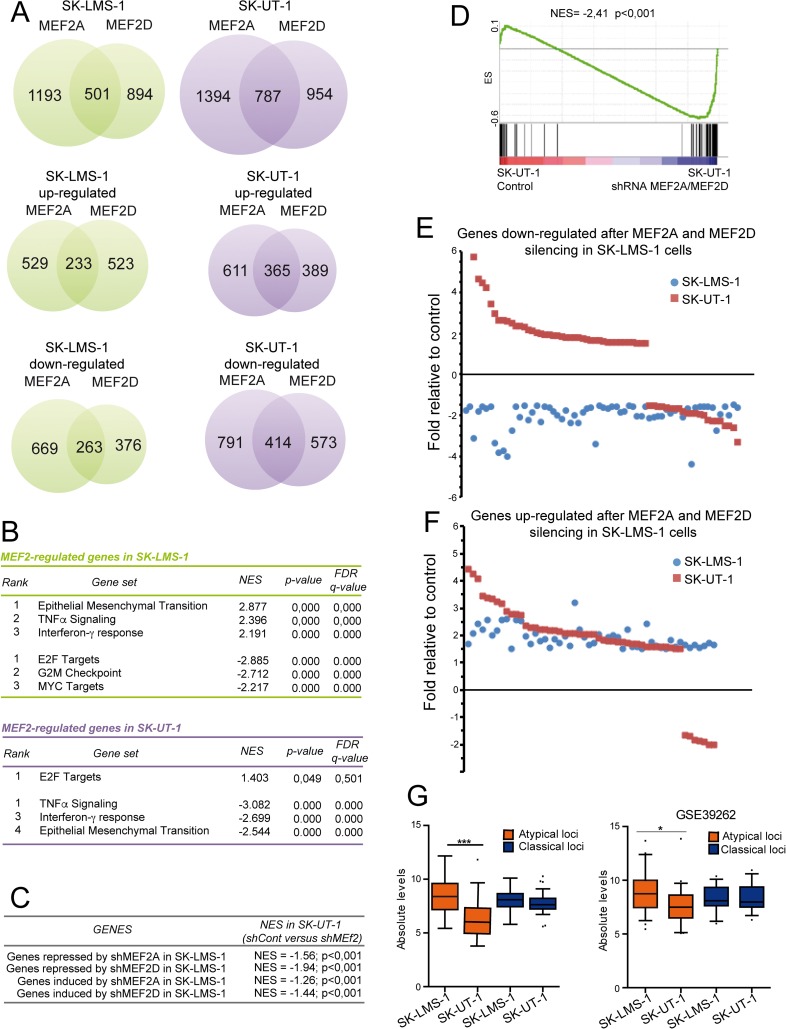
Fig 6. The MEF2 transcriptome.
A) Venn diagrams showing the number of transcripts differing significantly in response to MEF2A and MEF2D silencing in SK-LMS-1 cells (green) or in SK-UT-1 cells (violet). Differentially expressed genes (DEGs) were selected based on fold change >1.5 and <-1.5 fold and p values <0.05. B) Gene ontology (GO) analysis was performed to interpret the principal biological processes under the regulation of MEF2 in SK-LMS-1 and SK-UT-1 cells. The NES (normalized enrichment score), the FDR (false discovery rate) and the p-value are provided. C) GSEA was performed by using SK-UT-1 DNA microarray data and genes repressed or induced by MEF2D/A KD in SK-LMS-1 cells, as indicated. Two groups were created in SK-UT-1 samples: A = shControl; B = shMEF2D/A. D) GSEA was performed by using SK-UT-1 DNA microarray data and genes repressed both by MEF2D/A KD in SK-LMS-1 and significantly modulated also in SK-UT-1 cells. Two groups were created in SK-UT-1 samples: A = shControl; B = shMEF2D/A. E) Scatter plot representing genes commonly down-regulated after MEF2A and MEF2D silencing in SK-LMS-1 cells (blue dots) and significantly modulated, after the same silencing, also in SK-UT-1 cells (red squares). F) Scatter plot representing genes commonly up-regulated after MEF2A and MEF2D silencing in SK-LMS-1 cells (blue dots) and significantly modulated, after the same silencing, also in SK-UT-1 cells (red squares). G) Turkey box-plots illustrating the mRNA expression levels of classical and atypical MEF2-target genes in SK-LMS-1 and SK-UT-1 cells in our DNA microarray and in another public available DNA microarray study (GSE39262). * p < 0.05, ** p < 0.01, *** p < 0.001

