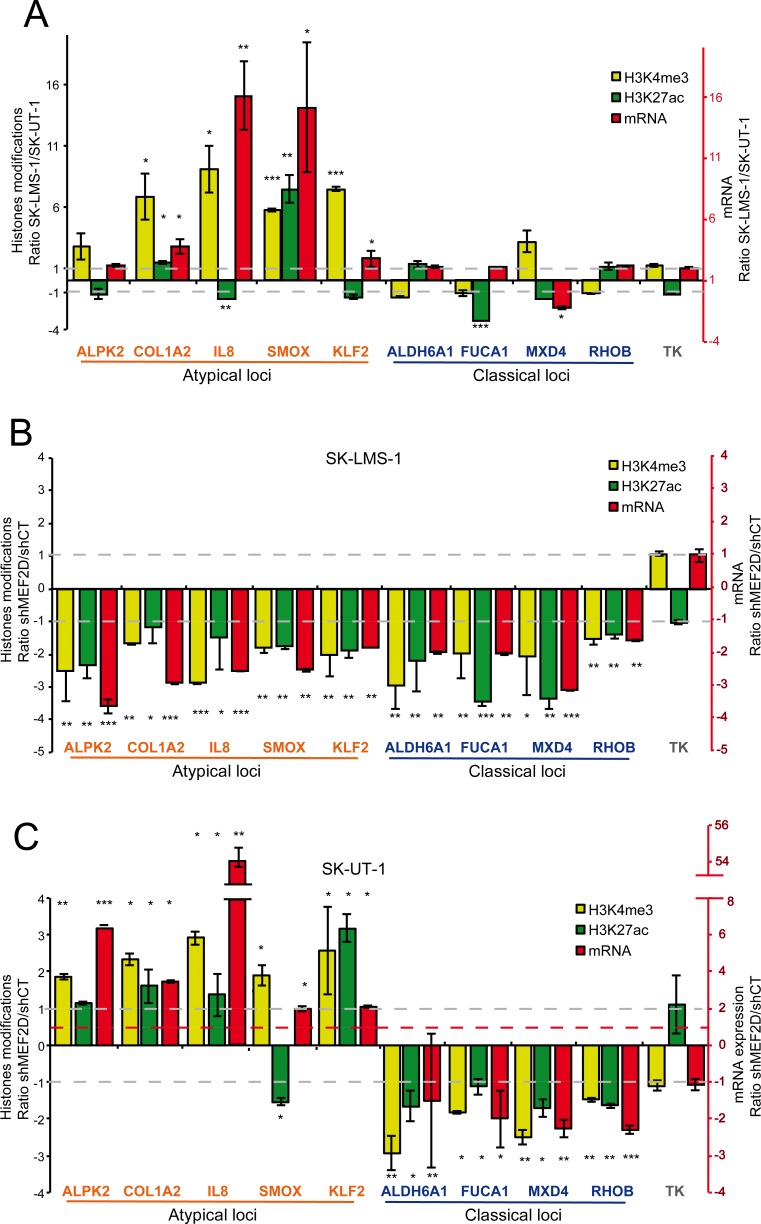
Fig 7. MEF2D supervised epigenetic changes on atypical and classical genes.
A) Ratio between SK-LMS-1 and SK-UT-1 cells of H3K27ac, H3K4me3 and mRNA levels for a set of atypical and classical genes. TK was used as control. B) Ratio between SK-LMS-1 cells, WT and KD for MEF2D expression, of H3K27ac, H3K4me3 and mRNA levels for a set of atypical and classical genes. TK was used as control. C) Ratio between SK-UT-1 cells, WT and KD for MEF2D expression, of H3K27ac, H3K4me3 and mRNA levels for a set of atypical and classical genes. TK was used as control. Data are presented as mean ± SD; n ≥ 3. The binding of MEF2 was validated by ChIP (S5 Fig) and the position of binding was expressed as relative to the major TSS, according to the hg38 assembly of the human genome. * p < 0.05, ** p < 0.01, *** p < 0.001

