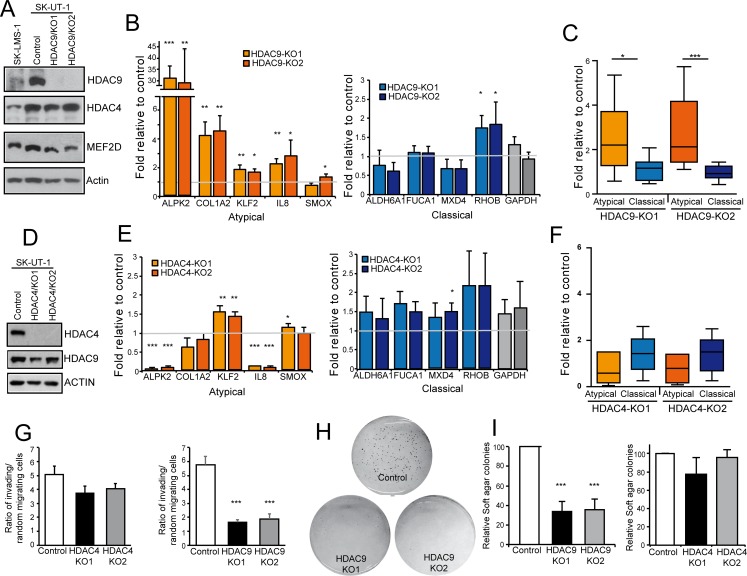
Fig 8. HDAC4 and HDAC9 KO in SK-UT-1 cells.
A) Immunoblot analysis of HDAC4, HDAC9 and MEF2D in the indicated SK-UT-1 clones. Two different HDAC9 KO clones were selected. Actin was used as loading control. B) mRNA expression levels of the indicated atypical and classical MEF2-target genes in SK-UT-1 cells WT or KO for HDAC9. Data are presented as mean ± SD; n = 3. C) Turkey box-plots illustrating the mRNA expression levels of classical and atypical MEF2-target genes in SK-UT-1 cells WT or KO for HDAC9. Dunn's Multiple Comparison Test was applied to test the significance. D) Immunoblot analysis of HDAC4 and HDAC9 in the indicated SK-UT-1 clones. Two different HDAC4 KO clones generated by different sgRNAs were selected. Actin was used as loading control. E) mRNA expression levels of the indicated atypical and classical MEF2-target genes in SK-UT-1 cells WT or KO for HDAC4. Data are presented as mean ± SD; n = 3. F) Turkey box-plots illustrating the mRNA expression levels of classical and atypical MEF2-target genes in SK-UT-1 cells WT or KO for HDAC4. Dunn's Multiple Comparison Test was applied to test the significance. G) Invasion properties of the SK-UT-1 cells WT, KO for HDAC4 or KO for HDAC9, as indicated. Data are presented as mean ± SD; n = 4. H) Example of growth in soft agar of SK-UT-1 cells WT or KO for HDAC9. Foci were stained with MTT. I) Quantitative results of colony formation assay for SK-UT-1 cells WT, KO for HDAC4 or KO for HDAC9, as indicated. Data are presented as mean ± SD; n ≥ 3. * p < 0.05, ** p < 0.01, *** p < 0.001

