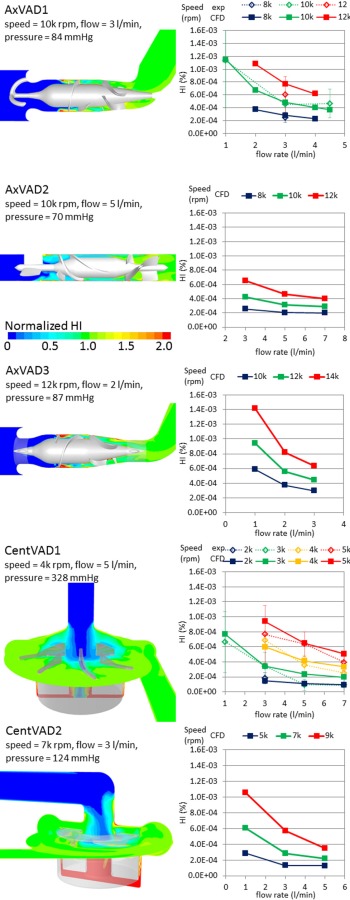
Fig. 8.

Left: contour plots of HI normalized to the outlet value to show the special variation in each VAD. Right: variation in the HI with the operating condition in each VAD and a comparison with the experimental data in the CentVAD1 and AxVAD1.

Left: contour plots of HI normalized to the outlet value to show the special variation in each VAD. Right: variation in the HI with the operating condition in each VAD and a comparison with the experimental data in the CentVAD1 and AxVAD1.