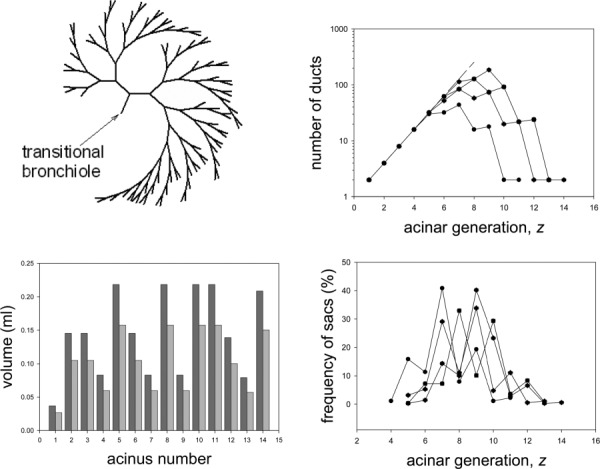
Fig. 3.

Schematic of a typical asymmetrically branching airway model acinus (shown without alveoli for clarity) (a); the number of ducts in each generation for all model acini (c); the frequency distribution of terminal ducts, or sacs, in the model acini (b); and volumes of the model acini at FRC in the upper (dark gray) and lower (light gray) egions of the lung (d)
