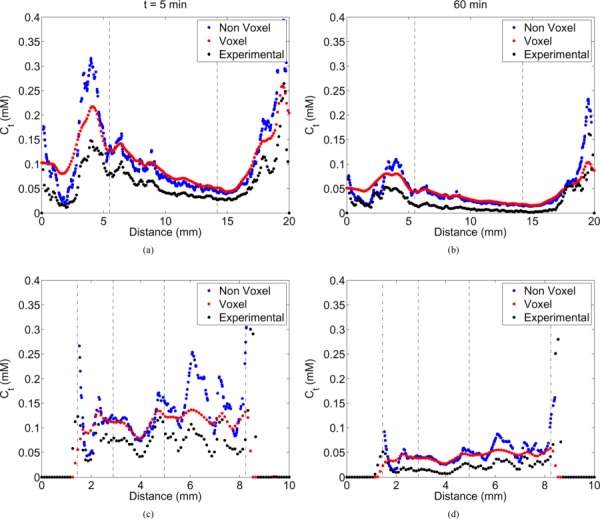
Fig. 6.

Line plots comparing the predicted tracer concentration in the tissue between the models and experiment along the horizontal (top row) and vertical (bottom row) bisectors of a mid-slice at t = 5 (a & c) and 60 (b & d) mins. The tumor and skin boundaries are represented by dashed and dash-dot lines, respectively.
