Figure 2.
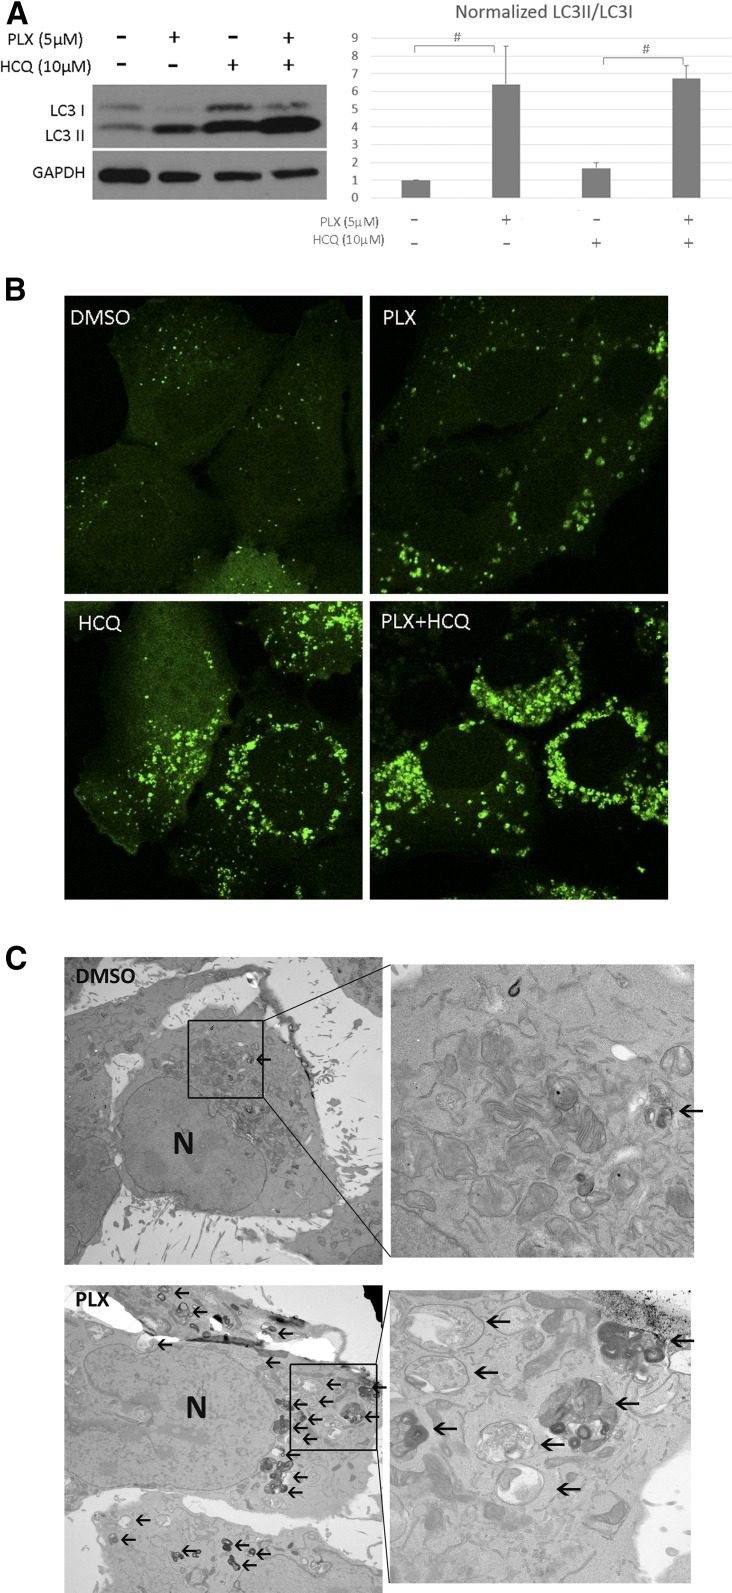
Vemurafenib treatment increased autophagosome formation in thyroid cancer cells. (A) Representative western blot result of FRO cells treated with DMSO, 5 µM PLX, 10 µM HCQ, and a combination of PLX and HCQ. The histogram presents ratio of LC3II/LC3I in 4 different groups. Error bars, SD from 3 independent experiments. (B) Representative images of FRO-GFP-LC3 cells under the treatment with vehicle (DMSO) or vemurafenib (PLX) for 48 hours with/without the presence of HCQ. (C) Transmission electron microscopy images of FRO cells exposed to PLX or DMSO for 48 hours. Typical autophagic vacuoles (AV) with multivesicular and double-layer membrane were frequently observed in PLX treated group but not in DMSO group (as indicated by black arrows). Graph shows quantification of mean ±SD of number of AVs per cell. Magnification ×5000 to 50,000. #P < 0.05. N, nucleus.

