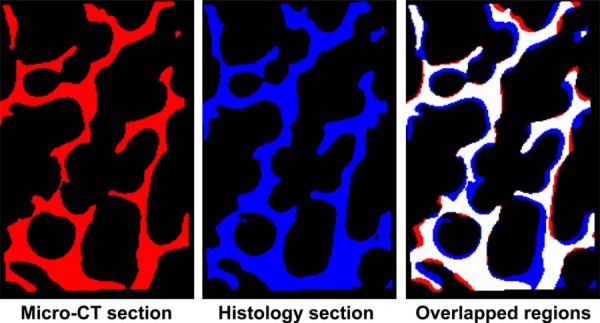
Fig. 5.

Using automated image registration, only overlapping regions were used to calculate the range of microdamage initiation. Registered trabecular bone structures in both micro-CT (left) and histology (middle) sections. Overlapped images (right) showing registered regions are in white. Only regions in white were utilized for analysis.
