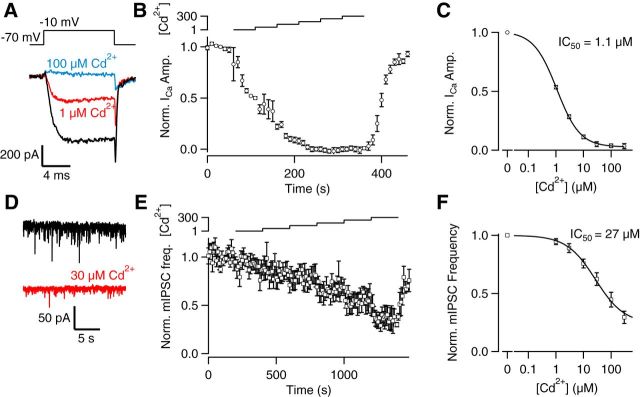
Figure 2.
Cd2+ apparently blocks VACC currents more potently than it inhibits spontaneous release of GABA. A, VACC currents activated by steps from −70 to −10 mV were substantially reduced by 1 μm (red) or 100 μm Cd2+ (blue) B, Average normalized diary plot of VACC current amplitude versus time following application of 0, 1, 3, 10, 30, 100, and 300 μm Cd2+ (n = 12). The bath contained 1.1 mm Mg2+ and 1.1 mm Ca2+, and micromolar [Cd2+] is indicated by the logarithmic scale above the plot. Currents were activated every 10 s, and each cell was normalized according to the average current recorded over the first 60 s. C, Concentration–effect relationship for normalized VACC currents recorded at steady-state [Cd2+] as indicated in B. D, Current traces showing mIPSCs before and during 30 μm Cd2+ (red). E, Average normalized diary plot of mIPSC frequency versus time following application of 0, 1, 3, 10, 30, 100, and 300 μm Cd2+ (n = 10). The bath contained 1.1 mm Mg2+ and 1.1 mm Ca2+, and micromolar [Cd2+] is indicated by the logarithmic scale above the plot. Each cell was normalized according to the average mIPSC frequency recorded over the first 200 s. F, Concentration–effect relationship for normalized mIPSC frequency recorded at steady-state [Cd2+] as indicated by the logarithmic scale above the plot in E.

