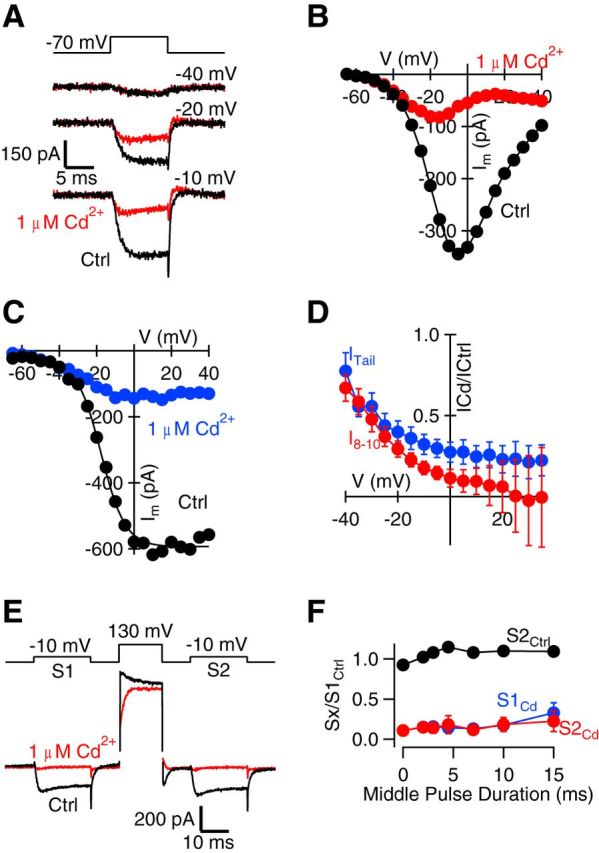
Figure 3.

Voltage dependence of Cd2+ block of VACC currents. A, Exemplary traces of 100 μm Cd2+-subtracted currents recorded at −40, −20, and −10 mV voltage-step protocols under control conditions (black) and in 1 μm Cd2+ (red). Notice the decrease in block at more hyperpolarized steps. B, I–V curve for VACC currents measured over the last 2 ms of the 10 ms voltage step (I8–10) from the same experiment in A. C, Plot of the peak amplitude of the tail currents from the same experiment versus the voltage step from the same experiment in A. Tail currents recorded in control conditions are indicated in black, and those recorded in the presence of 1 μm Cd2+ are indicated in blue. Tail current amplitude is measured as the minimum occurring within 200 μs after the voltage step. D, Plot of VACC current amplitude (red, I8–10) and tail current amplitude (blue, ITail) in 1 μm Cd2+ divided by that measured in control conditions and plotted against membrane potential (n = 4). Note the reduced block by Cd2+ at more hyperpolarized potentials and the increase in variability of the steady-state current at positive potentials. E, Exemplary traces of currents recorded in control conditions (black) and in 1 μm Cd2+ (red) with prepulse and postpulse currents (S1 and S2, respectively) recorded at −10 mV, where the current amplitude was maximal and the middle pulse was 130 mV. The middle pulse was increased in duration from 0 to 15 ms. Note the presence of the Cd2+-sensitive outward current resulting from the middle pulse. F, Plot of the ratio of the peak amplitude of the current measured (Sx) to the peak amplitude of the current measured for S1 under control conditions versus the duration of the middle pulse (n = 3). Sx described S2 under control conditions (black) or in the presence of 1 μm Cd2+ at either S1 (blue) or S2 (red). Error bars indicate SEM.
