Figure 5.
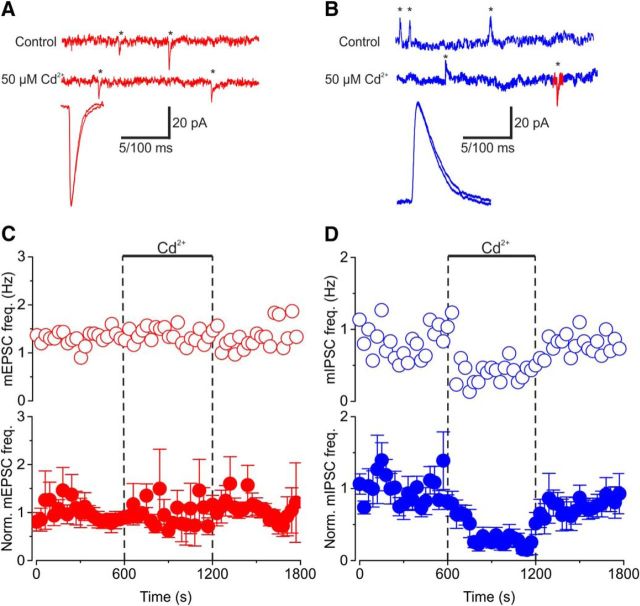
Cd2+ reduces spontaneous release of GABA and glycine but not glutamate in acute auditory brainstem slices. A, Exemplary current traces showing mEPSCs (red) before (top trace) and during (middle trace) application of 50 μm Cd2+. Asterisks denote individual release events. The bottom trace shows superimposed average mEPSCs after normalization for amplitude. B, Exemplary current traces showing mIPSCs (blue) before (top trace) and during (middle trace) application of 50 μm Cd2+. Note simultaneously recorded mEPSCs denoted in red. The bottom trace shows superimposed average mIPSCs after normalization for amplitude. C, D, Exemplary (open circles) and normalized average (closed circles) diary plots showing the effect of 50 μm Cd2+ (bar and dotted lines) on mEPSC (red) and mIPSC (blue) frequency (mean ± SEM) versus time. Calibrations: A, B, Top, middle traces, 20 pA, 100 ms; bottom traces, 5 ms.

