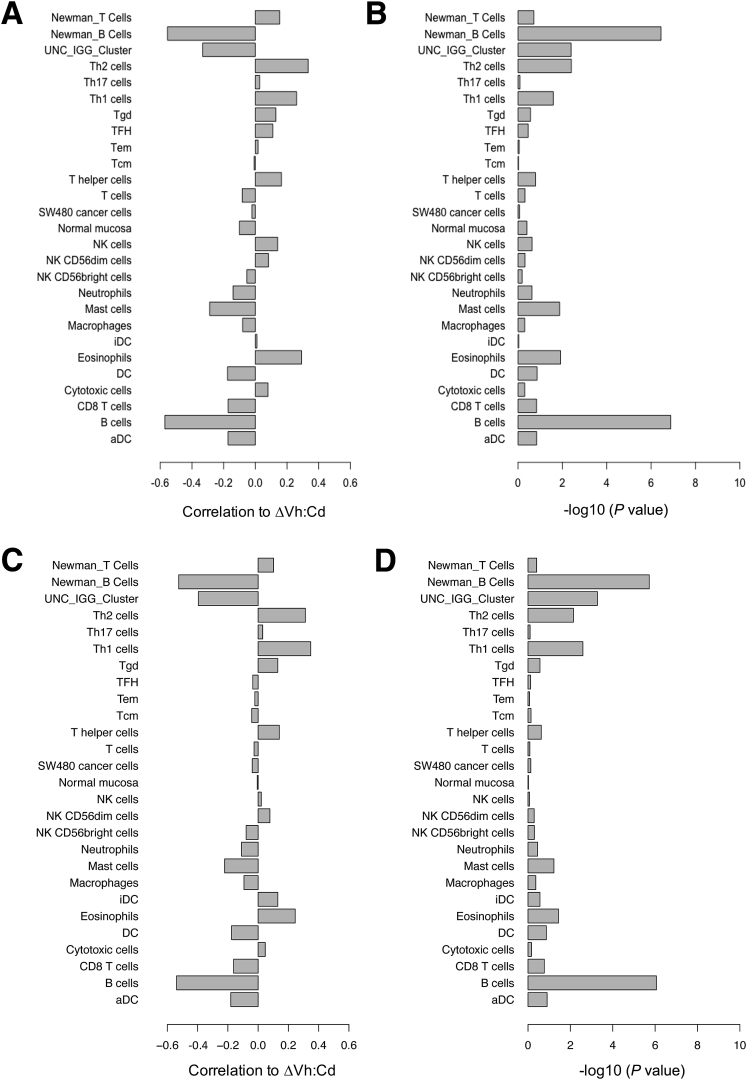
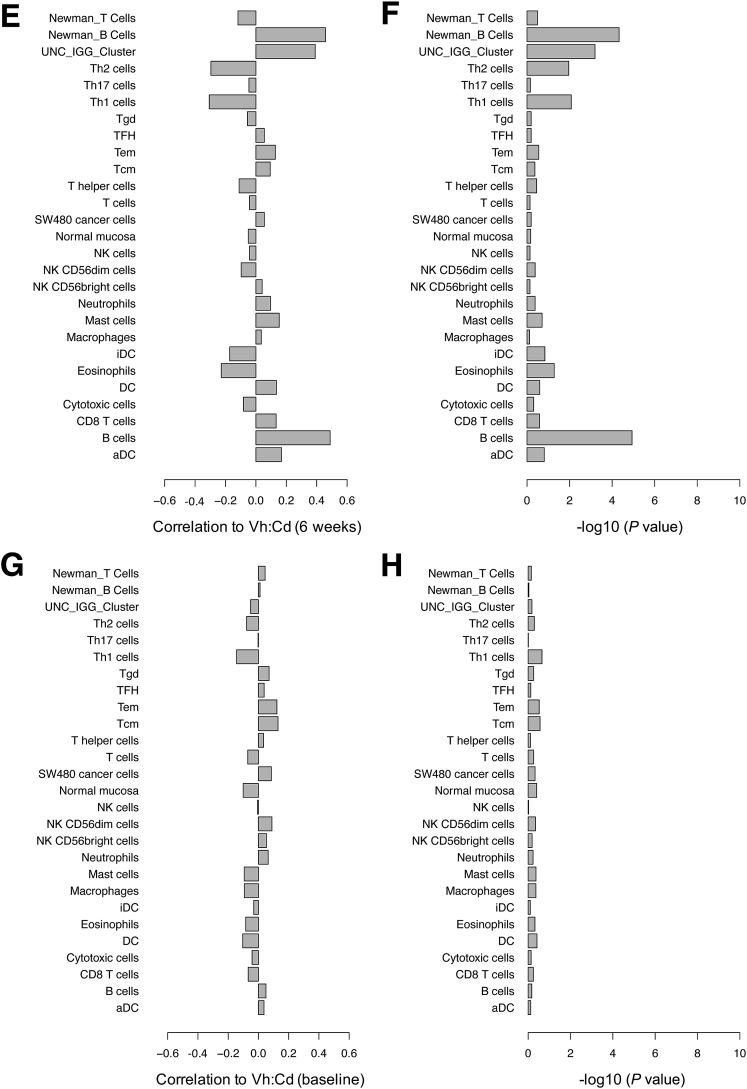
Figure 2.
Spearman rank correlation of gene signatures with the extent of gluten-induced intestinal injury. Gene lists obtained from three publications corresponded to B- and T-cell populations, other leukocytes, cancer cells, and normal mucosa (y-axis). All gene lists were obtained from Bindea et al,33 except for B- and T-cell lists from Newman et al34 (as indicated) and the University of North Carolina (UNC) IgG cluster from Fan et al.35 (A) The mean expression profile for a given gene list was correlated with ΔVh:Cd and the correlation was reported on a scale of 0 to 1 (x-axis). Multiple microarray probes corresponding to a single gene were consolidated to a single probe by taking only the probe with the greatest SD of expression across the 73 patients. (B) Significance for each correlation in panel A was expressed as a P value. Gene signatures also were correlated with (C) ΔVh:Cd, (E) end-of-study Vh:Cd, and (G) baseline Vh:Cd using mean expression profiles and all probes representing a given gene. Significance for each correlation in panels C, E, and G was expressed as a P value in panels D, F, and H, respectively. aDC, activated dendritic cell; DC, dendritic cell; iDC, immature dendritic cell; NK, natural killer; Tcm, T central memory; Tem, T effector memory; TFH, T follicular helper; Tgd, T gamma delta.


