Figure 1.

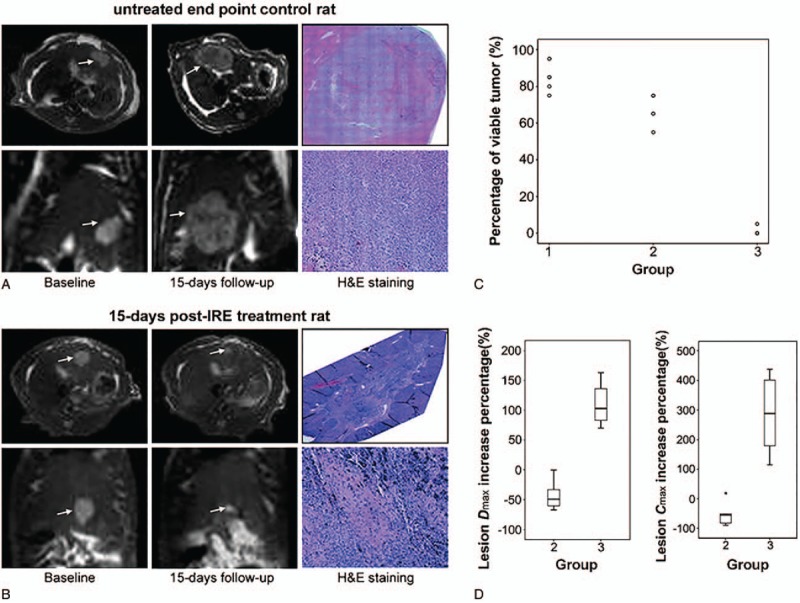
MRI images in axial and coronal orientations along with corresponding pathologic H&E slide images for an untreated 15-d end point control rat (A) and a 15-d post-IRE treatment rat (B).[29] A significant reduction of tumor size in IRE-treated animal (B) is shown compared to the untreated rat (A). Arrows indicate tumor positions. H&E pathology slides showed 70% viable tissue within the untreated tumor (A) and completed tumor regression within the IRE-treated rat (B). Scatter plot (C) shows the percentage of viable tumor tissue for 6 rats at baseline control interval (group 1), 6 untreated control rats following a 15-d growth period after original baseline scan (group 2), and 6 IRE-treated rats following the same 15-d growth period (group 3). Box plots (D) show the Dmax∗ increase (left) and Cmax∗ increase (right) for 15-d follow-up animals in untreated control group 2 and IRE-treated group 3. Dmax and Cmax increase for group 2 rats were significantly greater than Dmax and Cmax increase for group 3 rats (P = .004 for both comparisons using nonparametric Mann–Whitney U test). ∗Dmax, along the orientation bearing the largest tumor diameter; ∗Cmax, the cross-product of the maximum lesion diameter Dmax and largest diameter measured perpendicular to Dmax. IRE = irreversible electroporation, MRI = magnetic resonance imaging.
