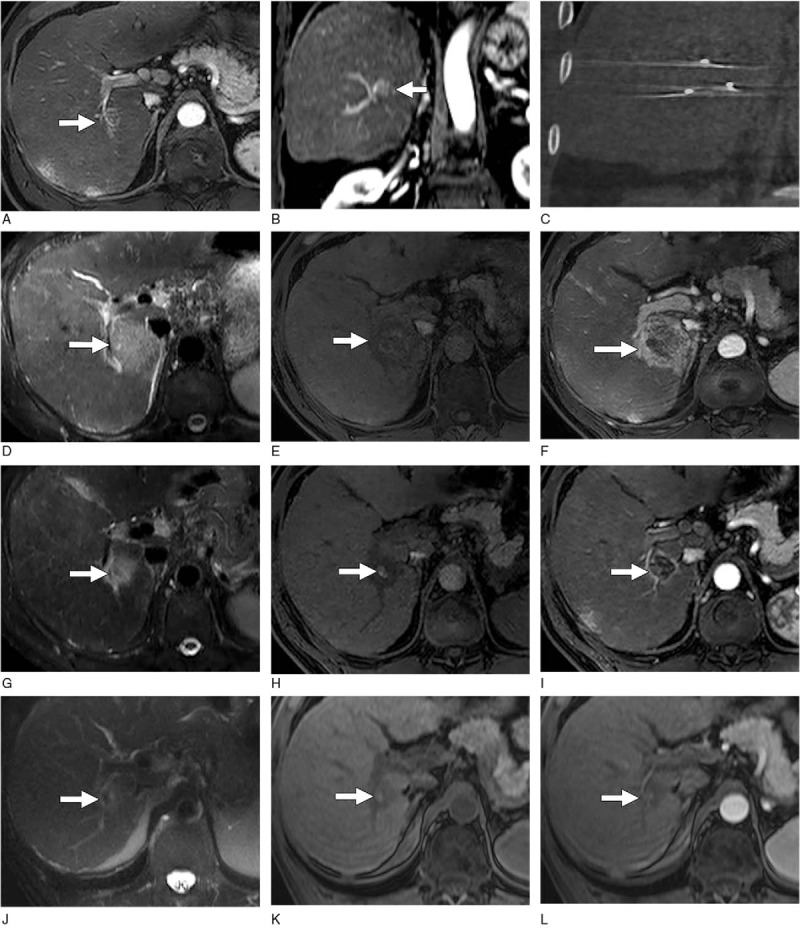
Figure 2.

MR images of HCC after IRE in a 63-year-old man.[49] Baseline axial (A) and coronal (B) gadolinium contrast-enhanced T1-weighted MR images obtained in the arterial phase show a 2-cm HCC lesion (arrow) in the right hepatic lobe adjacent to the right portal vein. (C) Unenhanced coronal CT image obtained after percutaneous IRE shows 3 electrodes in a parallel configuration. (D) T2-weighted MR image obtained 24 hours after IRE shows a large ablation zone (arrow) of diffuse increased signal intensity. (E) Unenhanced T1-weighted MR image obtained 24 hours after IRE shows slight hyperintensity of the ablated tumor with associated decreased signal intensity in the ablative margin (arrow). (F) T1-weighted MR image obtained in the arterial phase 1 day after IRE shows marked persistent enhancement of the ablative margin (arrow). The rumor itself demonstrates no enhancement. (G) T2-weighted MR image obtained 30 days after IRE shows a marked reduction of the ablation zone (arrow). (H) Unenhanced T1-weighted MR image obtained 30 days after IRE shows that the increased signal intensity of the tumor (arrow) persists. The size of the tumor decreased compared with day 1 after IRE. (I) T1-weighted MR image obtained in the arterial phase 30 days after IRE shows a substantial decrease in the size of the ablation zone compared with day 1 and thinning of the ablative margin (arrow). Unenhanced (J) T2- and (K) T1-weighted MR images obtained 120 days after IRE show further involution of the ablation zone and persistent slightly increased signal intensity of the tumor (arrow). (L) MR image obtained in the arterial phase shows a lack of enhancement in the entire ablation zone. CT = computed tomography, HCC = hepatocellular carcinoma, IRE = irreversible electroporation, MR = magnetic resonance.
