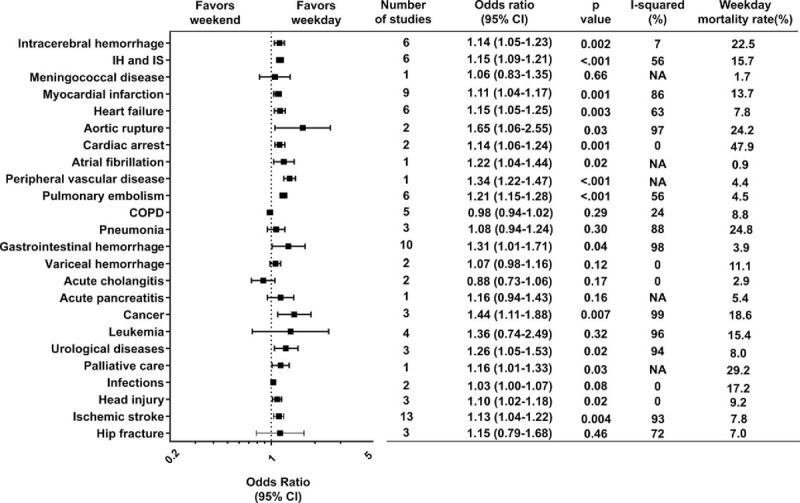
Figure 3.

Forest plot of odds ratios for the effect of weekend admission on short-term mortality, divided by disease category. Squares indicate point estimates of the pooled odds ratios. Horizontal line for each study denotes 95% confidence intervals. COPD = chronic obstructive pulmonary disease. CI = confidence interval, IH = intracerebral hemorrhage, IS = ischemic stroke, NA = not applicable.
