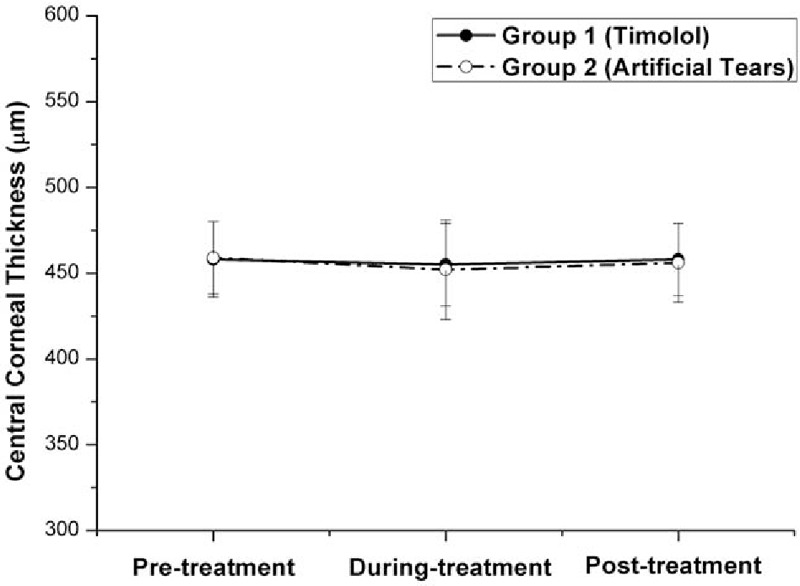
Figure 6.

Graph demonstrating the central corneal thickness (CCT) in eyes with myopic regression after laser in situ keratomileusis in the 2 treatment groups in different follow-up visits. Before treatment with eye drops (pretreatment), the differences in the mean CCT were not statistically significant between the 2 groups (P = .653, independent samples t test). The differences in the mean CCT ± SD among the 3 time points (pre-, during, and posttreatment) were not statistically different in each of the 2 groups (P > .05, one-way ANOVA test). ANOVA = analysis of variance.
