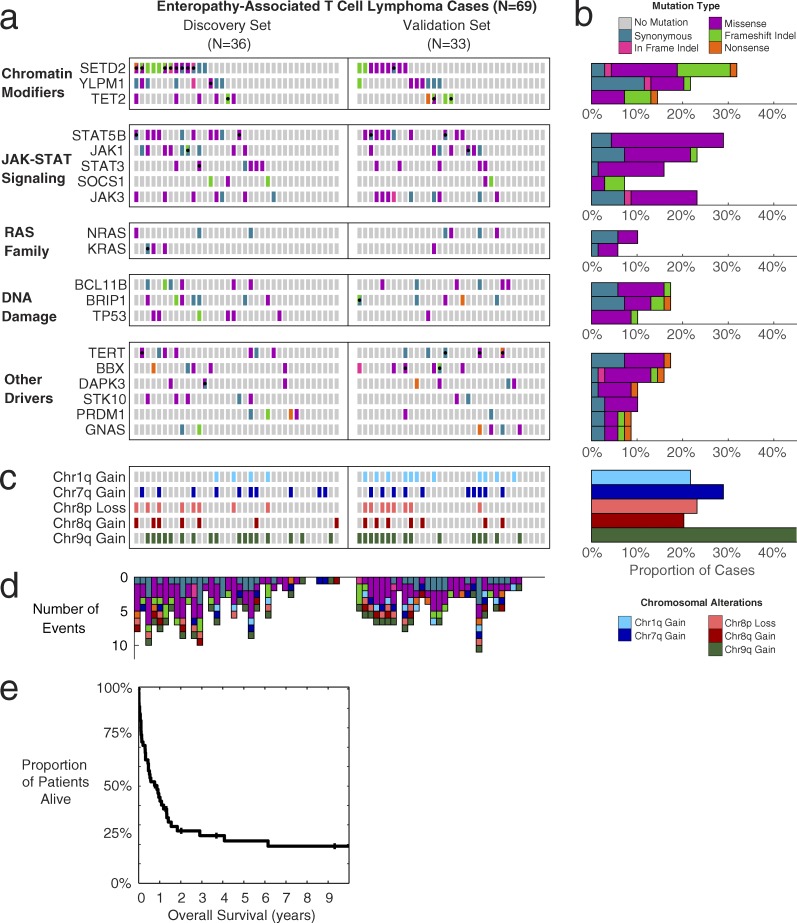
Figure 1.
Somatic mutations, copy-number alterations, and survival of EATL patients. (a) Heat map of mutations in EATL cohort (n = 69). Every box represents the mutation status of a patient for a particular gene. Columns are split into discovery set with paired normals (n = 36) and validation set (n = 33). Gray, no mutation; teal, synonymous SNV; pink, in-frame indel; purple, missense SNV; green, frameshift indel; orange, nonsense SNV. Black dots indicate more than one mutation in that gene/patient, with boxes split diagonally to show different functions of multiple mutations. (b) Bar graph showing the percentage of cases in the cohort affected by each mutated gene. Bars are color coded by the most-damaging event type observed in each patient. (c) Heat map of arm-level copy-number alterations for each patient (n = 69). Light blue, chr1q gain; dark blue, chr7q gain; light red, chr8p loss; dark red, chr8q gain; dark green, chr9q gain. (d) Bar graph showing number of events from mutated genes and copy-number alterations shown in the heat maps above (n = 69). Bars are color-coded based on the type of alteration. (e) Kaplan-Meier curve showing overall survival of the EATL cohort (n = 55 with available outcome data). Median survival is 10 mo; 1-yr survival rate is 44%.

