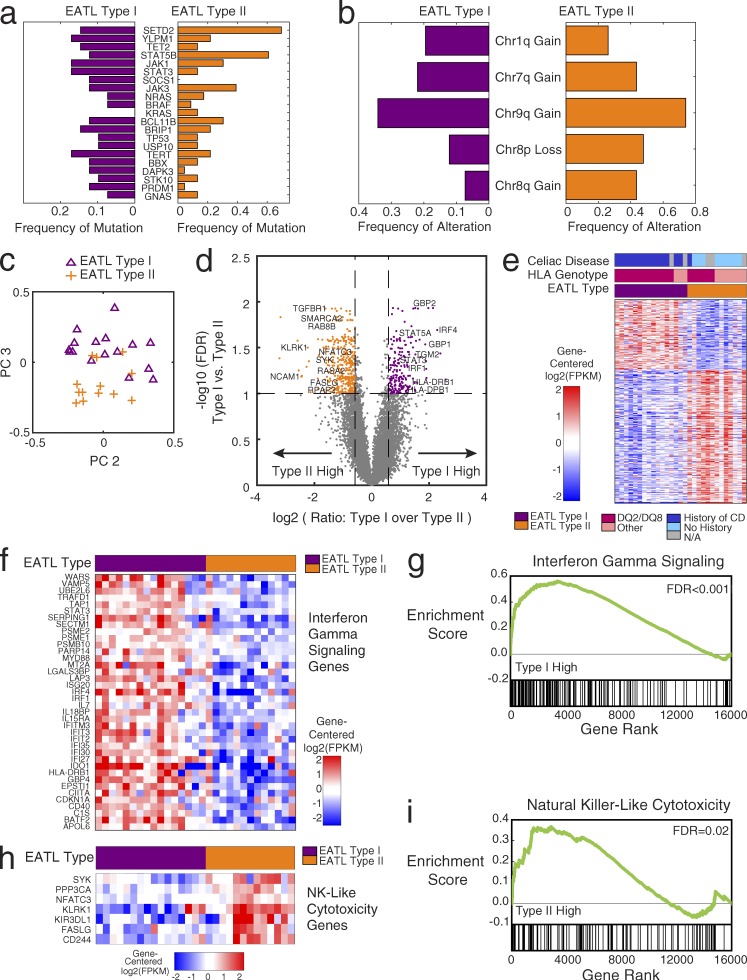
Figure 2.
Differences between type I and type II EATL: mutations, copy number, and gene expression. (a) Bar graph indicating frequency of mutation of each gene within the type I (n = 41) and type II (n = 23) EATL cohorts separately: type I frequency (purple; left); type II frequency (orange; right). (b) Bar graph indicating frequency of alteration of each arm-level copy-number alteration within the type I (n = 41) and type II (n = 23) EATL cohorts separately: type I frequency (purple; left); type II frequency (orange; right). (c) Principal-component (PC) analysis of EATL RNA-sequencing gene expression data (n = 29). The second principal component is on the x axis, and the third principal component is on the y-axis. One point is plotted for each sample in the analysis in the principal-component space, labeled by the clinical assignment of type I or type II. (d) Volcano plot showing the selection of differentially expressed genes between EATL type I (n = 16) and type II (n = 13). Every point is one gene in the analysis (number of significant genes is 578). The x axis shows the log2 transformed ratio of mean expression in the type I samples over the mean expression in the type II samples. The y axis shows the log10 transformed q-value (after Benjamini–Hochberg correction) of a Student’s t test between EATL type I and type II. Genes that pass the thresholds for significance (dotted lines) are colored in orange and purple (FDR <0.1 and fold change >1.5× in either direction). Notable genes are labeled with text. (e) Heat map showing the genes that are differentially expressed between EATL type I and type II (type I: n = 16; type II: n = 13; number of genes shown is 578). Genes are median centered per row. Red indicates higher expression; blue indicates lower expression. The color bar shows the twofold range of expression depicted. Genes shown have FDR <0.1 and fold change >1.5× in either direction. Bars above the heat map indicate the clinical subtype, HLA type, and history of celiac disease. (f) Differentially expressed genes in the interferon-γ signaling pathway, showing higher expression in the EATL type I samples (type I: n = 16; type II: n = 13). (g) Gene set enrichment plot showing the enrichment of interferon-γ genes at the top of the ranked list, with genes ordered by difference in type I versus type II (type I: n = 16; type II: n = 13). Gene set enrichment analysis KS-test FDR <0.001. (h) Differentially expressed genes in the natural killer (NK)–like cytotoxicity pathway, showing higher expression in the EATL type II samples (type I: n = 16; type II: n = 13). (i) Gene set enrichment plot showing the enrichment of natural killer–like cytotoxicity genes at the top of the ranked list, with genes ordered by difference in type II versus type I (type I: n = 16; type II: n = 13). Gene set enrichment analysis KS-test FDR = 0.02.

