Figure 3.
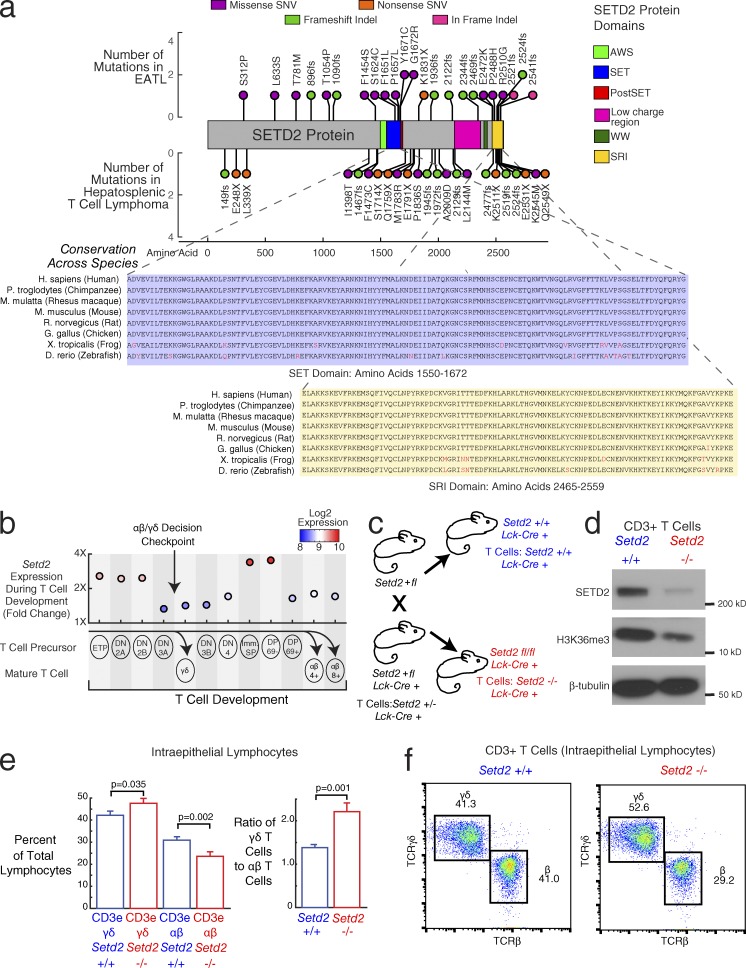
SETD2 as a driver of increased γδ T cell proliferation. (a) Stem plot showing distribution of mutations in SETD2. (Top) Mutations in EATL (n = 69). (Middle) Mutations in HSTL, a γδ-driven T cell lymphoma (n = 68). x axis indicates amino acid position of each mutation. y axis indicates number of patients with the same mutation. Circles are color coded by type of mutation (pink, in-frame indel; purple, missense SNV; green, frameshift indel; orange, nonsense SNV). Colored regions in protein diagram represent protein domains (lime green, AWS [associated with SET] domain; blue, SET domain; red, post-SET domain; pink, low-charge region; dark green, WW domain; yellow, SRI [Set2 Rpbl-interacting] domain). (Bottom) Conservation of SET (blue) and SRI (yellow) domain amino acid sequences. Nonconserved amino acids are colored in red. (b) Setd2 expression during T cell development. Labeled circles indicate different stages of T cell development. Corresponding scatterplot shows mouse gene expression (fourfold range) during development, with circles colored by expression. Values represent mean expression from two to three samples per group (34 total samples). αβ T cells differentiate from the DP early T cells, whereas γδ T cell differentiate from the DN3 stage of early T cell. Stages: early T precursor (ETP), DN2A, DN2B, DN3A, DN3B, DN4, immature single positive (Imm. SP), DP CD69− (DP 69−), DP CD69+ (DP 69+), γδ T cell (γδ), αβ CD4+ T cell (αβ 4+), αβ CD8+ T cell (αβ 8+). (c) Mouse breeding diagram. The final cross is between a heterozygous knockout Setd2+/fl mouse and a heterozygous knockout Setd2+/fl mouse with Cre transgene under the control of the T cell–specific Lck promoter (Lck-Cre+). The progeny mice that are used for downstream experiments are the wild-type Setd2 (+/+, blue) and null Setd2 (−/− in T cells, red), both with one copy of the Lck-Cre transgene. (d) Western blot in CD3+ splenic T cells from the Setd2 wild-type mouse (left) and Setd2-null mouse (right). (Top) SETD2 protein, (middle) H3K36 trimethylation, (bottom) β-tubulin control. Blot is representative of three experimental replicates. (e) Bar graph showing the quantification of CD3epos and TCRγδpos or CD3epos and TCRβpos T cell populations within IELs. Blue bars show populations from the Setd2+/+ wild-type T cells. Red bars show populations from the Setd2−/− null T cells. (Left) Left bars show γδ T cell receptor expressing populations, and right bars show αβ T cell receptor expressing populations. (Right) Ratio of γδ T cells to αβ T cells in Setd2+/+ T cells versus Setd2−/− T cells. Error bars show standard error of the mean. Two-way ANOVA tests were done for comparisons across genotype, correcting also for experimental batch. P-values for genotype differences are 0.035 (γδ T cells), 0.002 (αβ T cells), and 0.001 (ratio of γδ T cells to αβ T cells). Data are shown from five different experimental batches with a mean of five mice per batch. Total number of Setd2 wild-type mice: 11. Total number of Setd2-null mice: 15. (f) Flow cytometry representative plot showing the proportion of cells with TCR γδ and TCR β staining, corresponding to the αβ and γδ TCR-expressing T cell populations. (Left) Setd2 wild-type mouse (+/+). (Right) Setd2-null mouse (−/−). Plots are representative of results found comparing 11 Setd2 wild-type mice and 15 Setd2-null mice.

