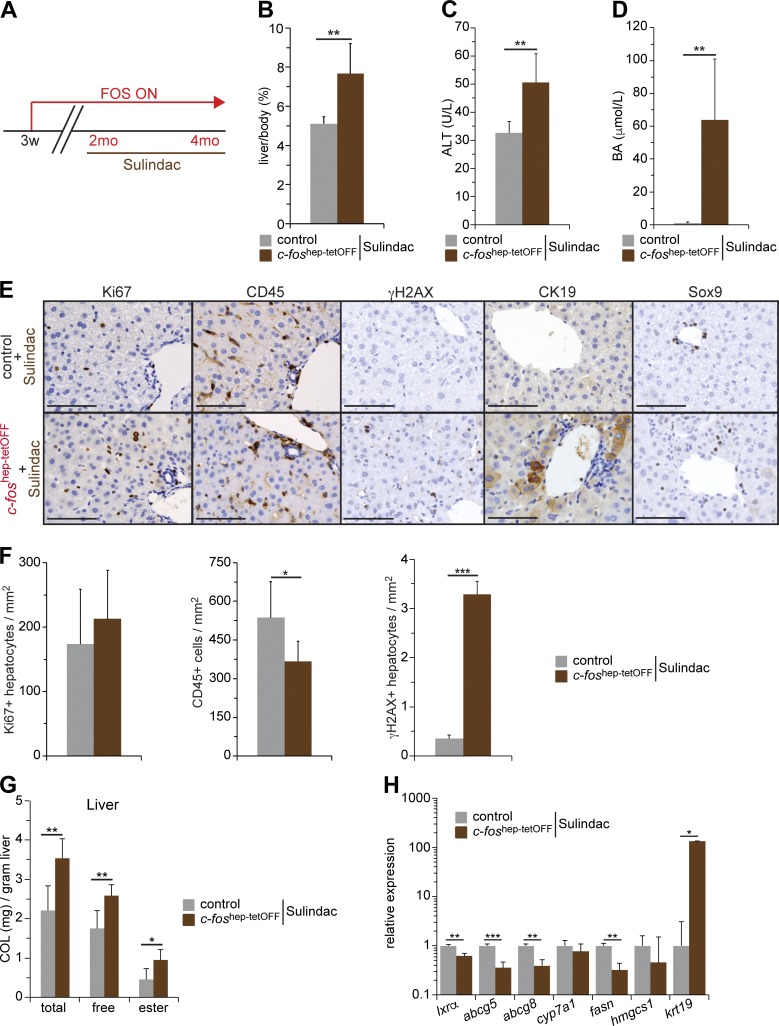
Figure 8.
Phenotypic consequences of inhibiting inflammation in c-foshep-tetOFF mice. (A) Ectopic expression of c-Fos was allowed during 2 mo and then combined with sulindac for an additional 2 mo. (B–D) Liver/body weight (B), serum ALT (C), and serum BAs (D) in sulindac-treated c-foshep-tetOFF and controls (n = 6/6). (E) Representative IHC for Ki67, CD45, γH2AX, CK19, and Sox9 in sulindac-treated c-foshep-tetOFF and controls. Bars, 100 µm. (F) Quantification of CD45-positive cells and Ki67- and γH2AX-positive hepatocytes in liver sections of sulindac-treated c-foshep-tetOFF and controls (n = 6/6). (G) Liver cholesterol species in sulindac-treated c-foshep-tetOFF and controls (n = 6/6). (H) qRT-PCR analyses in total liver tissue from sulindac-treated c-foshep-tetOFF and controls (n = 6/6, mean expression in controls set to 1). Bar graphs represent mean ± SD; *, P ≤ 0.05; **, P ≤ 0.01; ***, P ≤ 0.01 by Student’s t test.

