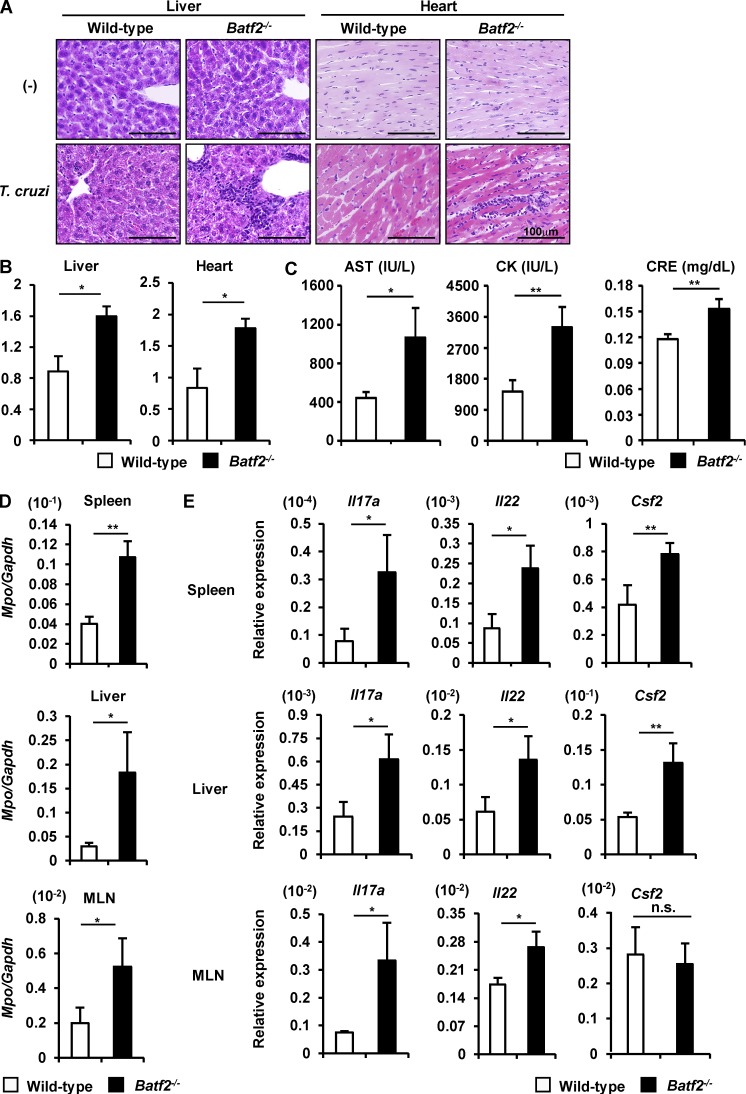
Figure 3.
Severe multiorgan pathology in T. cruzi–infected Batf2−/− mice. (A and B) Representative histopathology (A) and histopathological score (B) of wild-type (n = 8) and Batf2−/− (n = 9) mice 49 d after infection. Bars, 100 µm. Graphs show mean values ± SD. *, P < 0.01. (C) Concentrations of AST and CK in the plasma and CRE in tge sera of T. cruzi–infected wild-type (n ≥ 14) and Batf2−/− (n ≥ 19) mice. *, P < 0.05; **, P < 0.01. Graphs are mean values ± SEM. (D) Mpo expression in tissues of wild-type and Batf2−/− mice after T. cruzi infection (n = 3 per group). *, P < 0.05; **, P < 0.02. Data are mean values ± SEM. (E) Expression of Th17-related genes (n = 4 per group). *, P < 0.05; **, P < 0.02; n.s., not significant. All graphs show mean values ± SEM.

