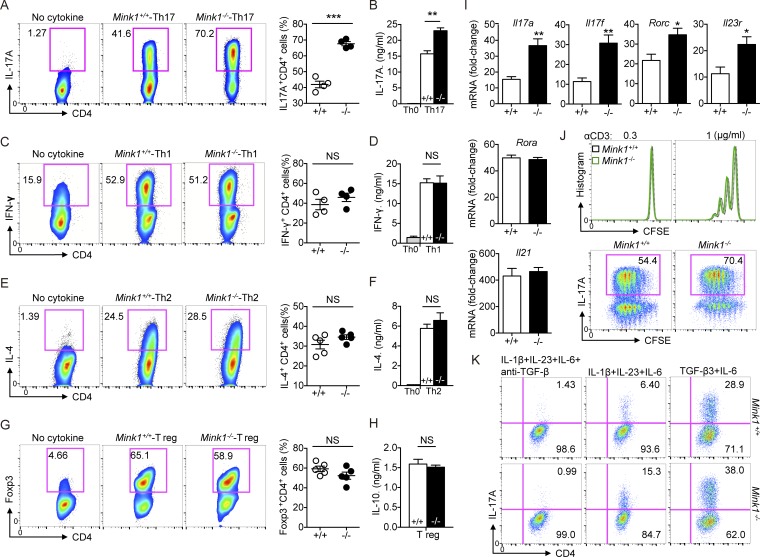
Figure 3.
MINK1 suppresses Th17 cell polarization in vitro. (A, left) Naive CD4+ T cells (CD4+CD62LhiCD44loCD25−) from Mink1−/− and WT mice were differentiated into Th17 cells with 10 ng/ml IL-6 and 3 ng/ml TGF-β1. On day 5, the differentiated cells were stimulated with PMA + ionomycin for 5 h. The frequencies of IL-17A+ cells were determined by flow cytometry. (Right) Percentages of IL-17A+CD4+ T cells generated from in vitro polarization. (B) On day 5 after in vitro polarization, the supernatants of cell cultures were collected, and the secreted amounts of IL-17A were measured by ELISA. (C–H) Naive CD4+ T cells from Mink1−/− and WT mice were polarized under Th1 (C), Th2 (E), and iT reg (G) cell conditions and analyzed by flow cytometry 5 d after differentiation. Cytokines secreted into the cell culture supernatant (D, F, and H) were measured by ELISA. (I) Naive CD4+ T cells from Mink1−/− and WT mice were differentiated into Th17 cells with 10 ng/ml IL-6 and 3 ng/ml TGF-β for 5 d. The indicated genes’ expressions were analyzed by real-time PCR. (J, top) CFSE staining of naive T cells after 3 d of stimulation in the presence of plate-bound anti-CD3 antibody. (Bottom) Representative intracellular staining of IL-17A against CFSE on day 5 as in Fig. 3 A. (K) Naive CD4+ T cells from Mink1−/− and WT mice were differentiated into Th17 cells with the indicated cytokines. Induction of IL-17A+ cells was analyzed 5 d after differentiation. When indicated, the TGF-β antibody was added throughout the culture. The numbers in the flow cytometry graphs show the percentages of the gated populations. Error bars show mean ± SD. *, P ≤ 0.05; **, P ≤ 0.01; ***, P ≤ 0.001. n = 3–6 in each group; Student’s t test. Data are representative of three experiments.

