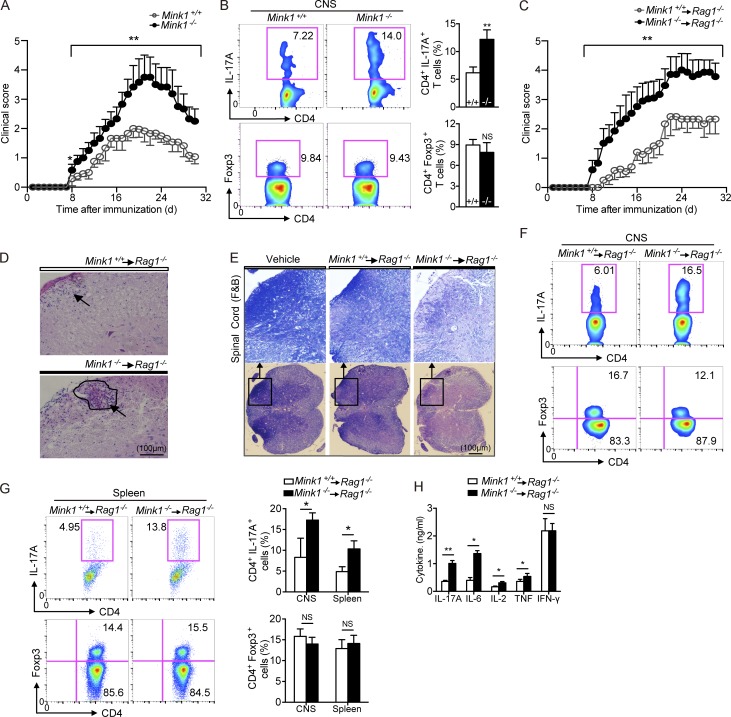
Figure 4.
T cell–intrinsic effects of MINK1 deficiency in EAE induction and Th17 cell accumulation. (A) Mean clinical scores for EAE in Mink1−/− and WT mice after being immunized with MOG35–55 + CFA plus pertussis toxin. (B, left) 18 d after EAE induction (at the peak of disease), CD4+ T cells were gated from the isolated leukocytes in the CNS and further analyzed for the frequencies of IL-17A+ and Foxp3+ cells. (Right) Summary of CNS IL-17A+CD4+ and Foxp3+CD4+ cells in Mink1−/− and WT EAE mice. (C) Mean clinical scores for EAE in Rag1−/− recipients of Mink1−/− and WT naive CD4+ T cells. (D and E) Representative histology of the spinal cord (hematoxylin and eosin in D and Luxol fast blue [F&B] in E) of Rag1−/− mice after EAE induction (day 32). (D) Arrowheads indicate inflammatory infiltration. (E) Outlines indicate demyelination by loss of normal blue staining of myelin. (F) On day 18 after EAE induction of Rag1−/− hosts, CD4+ T cells were gated from leukocytes isolated from the CNS and analyzed for the frequencies of IL-17A+ and Foxp3+ cells. (G, left) On day 18 after EAE induction of Rag1−/− hosts, spleen CD4+ T cells were analyzed for IL-17A+ and Foxp3+ expression. (Right) Summary of CNS and splenic IL-17A+CD4+ and Foxp3+CD4+ cells in Rag1−/− EAE mice. (H) Splenocytes isolated from EAE Rag1−/− mice (day 20) were restimulated in vitro with 5 µg/ml MOG peptide for 3 d, and then, the indicated cytokine production in the culture supernatants was assessed by ELISA. The numbers in the flow cytometry graphs show the percentages of the gated populations. Error bars show mean ± SD. *, P ≤ 0.05; **, P ≤ 0.01; Student’s t test. Data are representative six pairs of mice from two independent experiments.

