Figure 6.
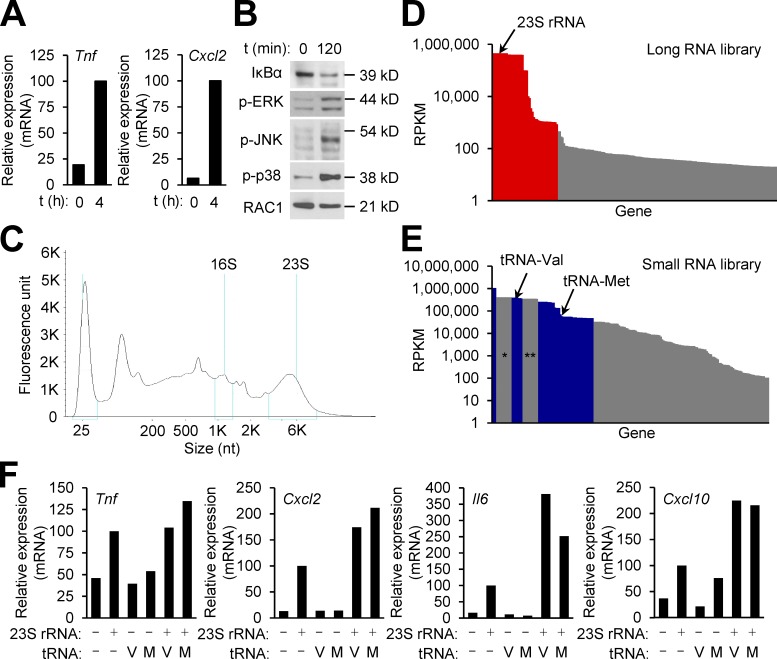
BA spores harbor immunostimulatory RNA. (A and B) WT mouse macrophages were treated with RNA (1 and 0.25 µg/ml; A and B, respectively) isolated from BA spores. Relative RNA amounts for spore-induced genes at the indicated time points after exposure were determined by qPCR, and plotted on a linear scale (A). Whole-cell lysates were prepared at the indicated time points after exposure, and analyzed by immunoblotting (B). (C) BA spore RNA was analyzed by Bioanalyzer electrophoresis. The positions of bacterial rRNA and size markers are indicated at the top and bottom, respectively. (D and E) The composition of BA spore RNA was determined by RNA-Seq. The sequence reads from the long and small RNA libraries (D and E, respectively) were used to calculate RPKM values for each gene. RNA components with RPKM >20 (D) and 100 (E) are plotted. Red and blue columns correspond to the RNA components listed in Tables S1 and Table S2, respectively. * and **, columns representing degraded 23S and 16S RNA, respectively. (F) WT mouse macrophages were treated with the indicated synthetic and in vitro-transcribed RNA (1 µg/ml) isolated from BA spores. Relative RNA amounts for spore-induced genes 4 h after exposure were determined by qPCR, and plotted on a linear scale. Data are representative of two experiments with similar results (A, B, and F) or from one experiment (C–E).

