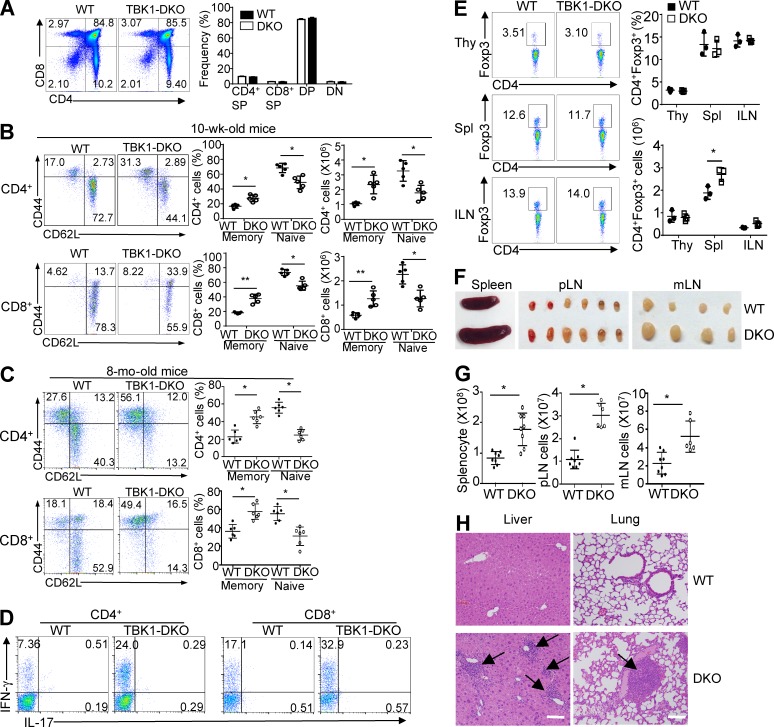
Figure 2.
TBK1 deficiency in DCs impairs T cell homeostasis and causes autoimmunity. (A) Flow cytometric analysis of thymocytes in Tbk1-DKO and WT control mice, with the percentage of double-negative (DN), double-positive (DP), and CD4+ and CD8+ single-positive (SP) populations summarized based on three WT and three Tbk1-DKO mice (8 wk old). Data are presented as means ± SD. (B and C) Flow cytometric analysis of the frequency and absolute number of naive (CD44loCD62Lhi) and memory-like (CD44hiCD62Llo for CD4+ and CD44hi for CD8+ T cells) CD4+ and CD8+ T cells in total splenocytes from WT and Tbk1-DKO mice (10 wk and 8 mo old). Data are presented as representative plots (left) and summary graphs (right). (D) Flow cytometric analysis of the percentage of IFN-γ–producing and IL-17–producing CD4+ and CD8+ T cells in the spleen of 8-mo-old WT and Tbk1-DKO mice. (E) Frequency of CD4+Foxp3+ T reg cells in the thymus (Thy), spleen (Spl), and inguinal lymph nodes (ILN) of 10-wk-old WT and Tbk1-DKO mice, presented as a representative FACS plot (left) and summary graph based on multiple mice (right). (F and G) Representative images (F) and total cell number (G) of spleen, peripheral lymph nodes (pLN), and mesentery lymph nodes (mLN) of WT and Tbk1-DKO mice (8 mo old). (H) Hematoxylin-eosin staining of the indicated tissue sections from 8-mo-old WT and Tbk1-DKO mice, showing immune cell infiltrations in the Tbk1-DKO tissues (arrows). Bars, 100 µm. Data are representative of three or more independent experiments. *, P < 0.05; **, P < 0.01.

