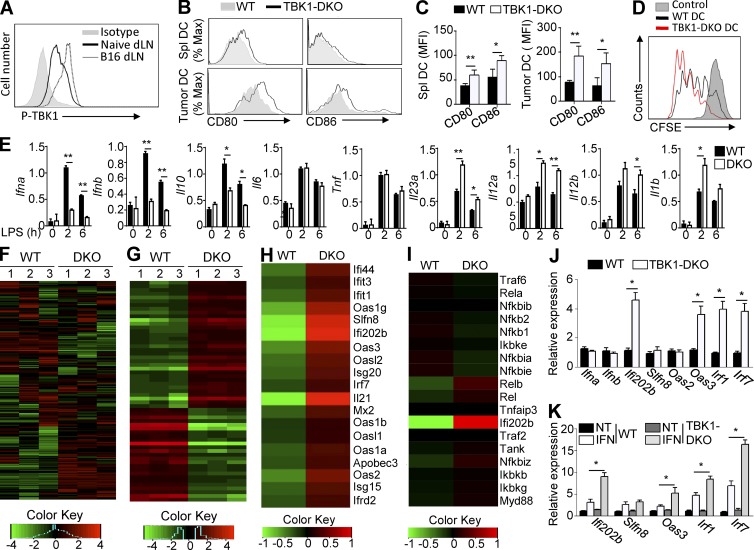
Figure 5.
TBK1 regulates the expression of IFN-response genes in DCs. (A) Flow cytometric analysis of phosphorylated TBK1 (P-TBK1) in CD11c+ DCs isolated from the draining LNs (dLN) of untreated (naive) mice or mice injected s.c. with B16 melanoma cells. (B and C) Flow cytometric analysis of CD80 and CD86 expression on WT or Tbk1-DKO spleen CD11c+ DCs (Spl DC) and B16 tumor-infiltrating CD11c+ DCs (Tumor DC). MFI, mean fluorescence intensity. (D) Flow cytometric analysis to measure the proliferation of CFSE-labeled OTII T cells incubated with either medium control or OVA-pulsed WT and Tbk1-DKO spleen DCs. (E) qRT-PCR analysis of the indicated genes using LPS-stimulated splenic DCs derived from WT and Tbk1-DKO mice (8 wk old). (F–I) RNA-sequencing analysis using splenic DCs freshly isolated from 8-wk-old WT and Tbk1-DKO mice (each group has three samples), showing a heat map of highly variable genes (top 1,500; F), genes with adjusted p-value <0.01 and log2 fold-change >1.5 (G), IFN-responsive genes (H), and NF-κB signature genes using the IFN-responsive gene Ifi202b as a positive control (I). (J) qRT-PCR analysis of the indicated genes in freshly isolated splenic DCs from WT and Tbk1-DKO mice (8 wk old). (K) qRT-PCR analysis of the indicated genes using splenic DCs from J that were starved for 6 h and then either not treated (NT) or stimulated with IFN-β for 3 h. Data are representative of three independent experiments and are presented as means ± SD. *, P < 0.05; **, P < 0.01.

