Figure 7.
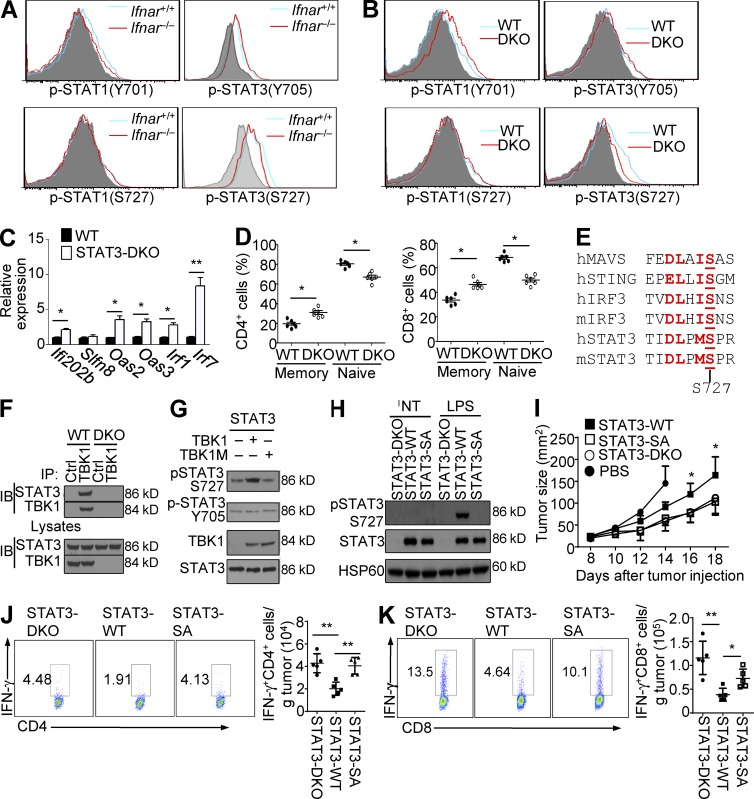
TBK1 mediates STAT3 phosphorylation in DCs. (A and B) Flow cytometric analysis of tyrosine (Y701) and serine (S727) phosphorylation of STAT1 and STAT3 in freshly isolated splenic CD11c+ DCs from 8-wk-old Ifnar+/+ and Ifnar−/− mice (A) or 8-wk-old WT and Tbk1-DKO mice (B). (C) qRT-PCR analysis of the indicated genes in freshly isolated splenic CD11c+ DCs from age- and sex-matched WT and Stat3-DKO mice (8 wk old). (D) Flow cytometric analysis of naive (CD44loCD62Lhi) and memory-like (CD44hiCD62Llo) CD4+ and CD8+ T cells in splenocytes from age- and sex-matched WT and Stat3-DKO mice (3 mo old). (E) Sequence alignment of the S727 phosphorylation site of STAT3 with the phosphorylation site of several known TBK1 substrate proteins. Conserved residues are shown in red, and the phosphorylation serine is underlined. MAVS, mitochondrial antiviral-signaling protein. (F) Lysates of WT or Tbk1-DKO splenic DCs were subjected to IP using anti-TBK1 or a control Ig (Ctrl); TBK1 and TBK1-associated STAT3 were detected by immunoblotting (IB). (G) Immunoblot analysis of STAT3 phosphorylation in HEK293T cells transfected with STAT3 along with either TBK1 or a catalytically inactive TBK1 mutant (TBK1M). (H) Immunoblot analysis of S727 phosphorylated STAT3, total STAT3, and loading control HSP60 in BMDCs prepared from STAT3-WT, Stat3-DKO, or STAT3-S727A mutant (STAT3-SA) mice, either not treated (NT) or stimulated with LPS. (I) Tumor growth curve of WT mice injected s.c. with B16-OVA melanoma cells and then injected i.v. (on day 7) with BMDCs described in H that were pulsed with OVA peptide and matured with LPS. (J and K) Tumor-infiltrating CD4+ (J) and CD8+ (K) T cells from the tumor-bearing mice described in I, presented as representative FACS plots (left) and summary graphs based on multiple mice (right). Data are representative of three or more independent experiments and are presented as means ± SD. *, P < 0.05; **, P < 0.01.

