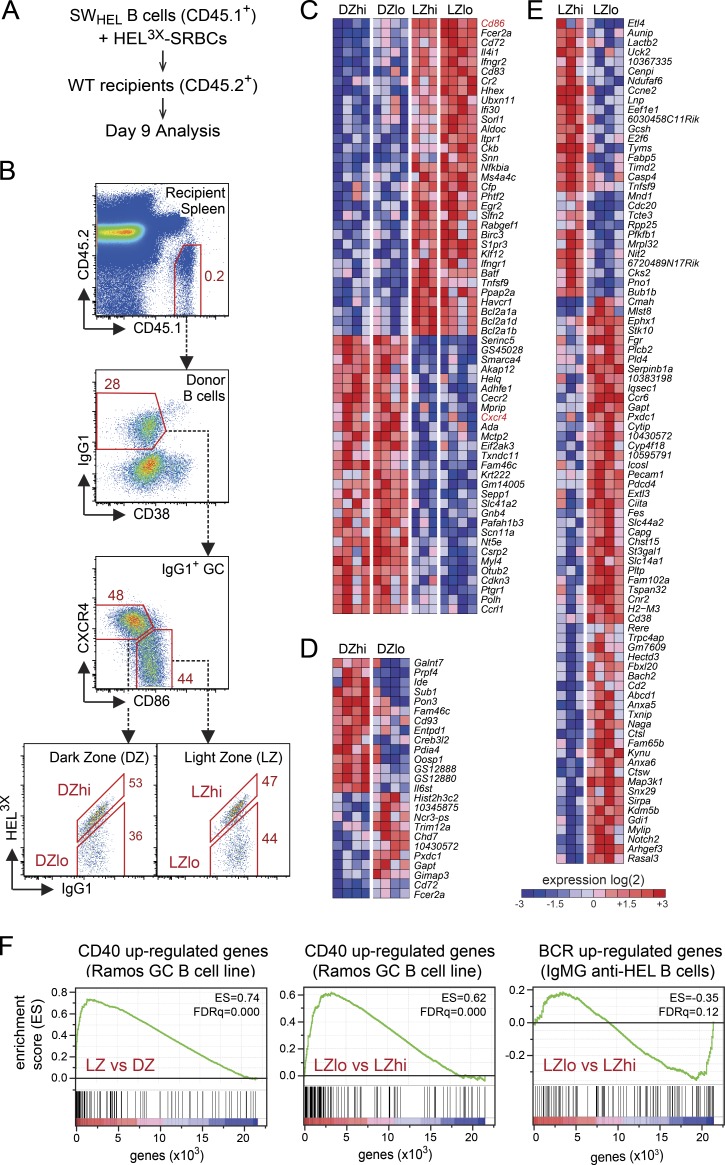
Figure 1.
Identification of high- and low-affinity LZ and DZ SWHEL GC B cells and their affinity-dependent gene expression signatures. (A) General experimental strategy. (B) Flow cytometric gating used to sort and characterize donor-derived SWHEL GC B cells. IgG1+ GC B cells are resolved into high- and low-affinity DZ and LZ populations (DZhi, DZlo, LZhi, and LZlo). (C) Heat map showing genes differentially expressed between DZ and LZ GC B cells regardless of BCR antigen affinity. Genes encoding markers used to define the DZ and LZ subsets (Cd86 and Cxcr4) are indicated in red. The fold-change cutoff was set to ≥1.5984 (= fold-change up-regulation of Cxcr4 in DZ vs. LZ) with P ≤ 0.0005. (D and E) Heat maps showing genes differentially expressed according to BCR antigen affinity within either the DZ (D) or LZ (E). (F) GSEA of relative gene expression in total LZ versus total DZ GC B cells (left) or LZlo versus LZhi GC B cells (middle) against the gene set identified as up-regulated after CD40L stimulation of the human GC B cell line Ramos (Basso et al., 2004) and LZlo versus LZhi GC B cells against genes up-regulated by antigen (HEL) stimulation of B cells expressing an IgM BCR with an IgG1 cytoplasmic tail (Horikawa et al., 2007). FDRq, false discovery rate. Gene expression data represent four independent experiments of 25 mice per experiment.

