Figure 1. Three populations of cells from A. maculatum egg capsules containing stage 39 embryos were collected and prepared for mRNA extraction, cDNA sequencing, and differential expression analysis revealing several hundred significantly differentially expressed genes detected for the salamander and alga.
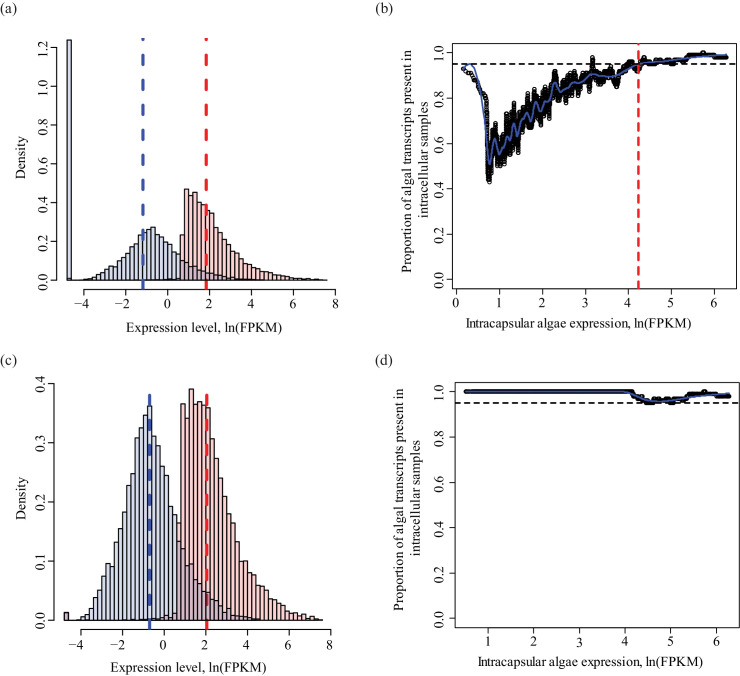
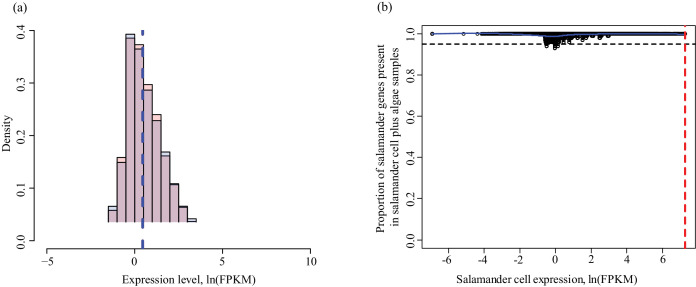
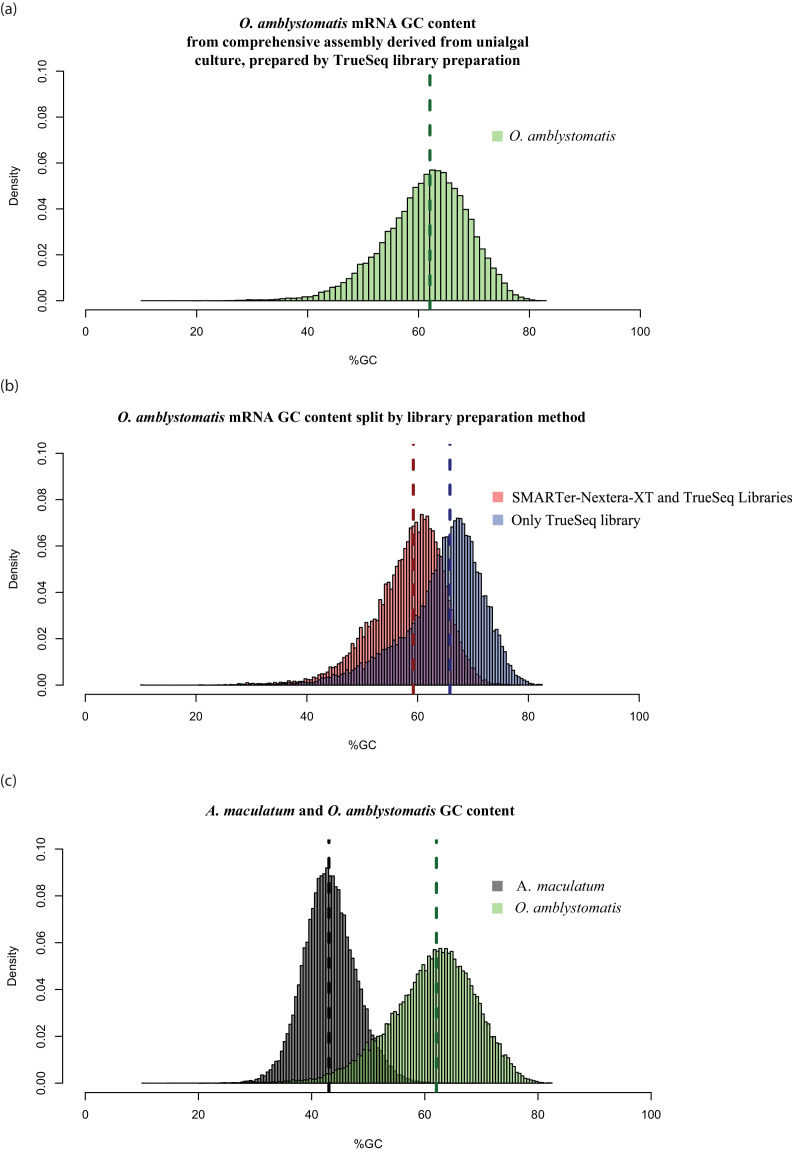
(a) Intracapsular algae (Population 1) were removed from intact eggs using a syringe and hypodermic needle (photo credit: Roger Hangarter). Embryos were decapsulated and washed, and the liver diverticulum region (dashed line), containing high concentrations of algae (red dots), was isolated and dissociated into a single cell suspension (illustration adapted from Harrison, 1969). The dissociated cells were screened for A. maculatum endoderm cells without alga (black arrowheads) and endoderm cells with intracellular alga (green arrowhead). Scale bars on microscope images are 20 µm. (b) Isolated endoderm cell, and isolated endoderm cell with intracellular alga. Scale bars on microscope images are 20 µm. (c) Representative cDNA distribution (bioanalyzer trace) from a population of 50 manually isolated A. maculatum endoderm cells. Peaks at 35 bp and 10380 bp are markers. Due to evidence of lysed A. maculatum cells observed in the cell suspension fluid after dissociation of A. maculatum embryos (debris seen in dissociated A. maculatum microscope images in (a) and (b)), that fluid was tested for the presence of contaminating mRNA. mRNA was not detected in the surrounding fluid, Figure 1—figure supplement 1. Lower limit abundance thresholds (Figure 1—figure supplement 2), and correction for low sequencing depth in intracelluar algal samples (Figure 1—figure supplement 3) were implemented to obtain the final gene sets used for differential expression analysis. Depth of sequencing was not biased for A. maculatum cell with and without alga samples (Figure 1—figure supplement 4). Library preparation GC bias affected the completeness of the algal transcriptome obtained from intracapsular and intracellular O. amblystomatis (Figure 1—figure supplement 5). (d and e) Dotplots of log2 fold change vs. expression level. The blue horizontal lines are plus and minus 4-fold change in expression between samples. The red dots are genes with FDR adjusted p-values<0.05, indicating a significant difference in expression level between conditions. (d) Differentially expressed algal transcripts. (e) Differentially expressed salamander transcripts.
DOI: http://dx.doi.org/10.7554/eLife.22054.003


