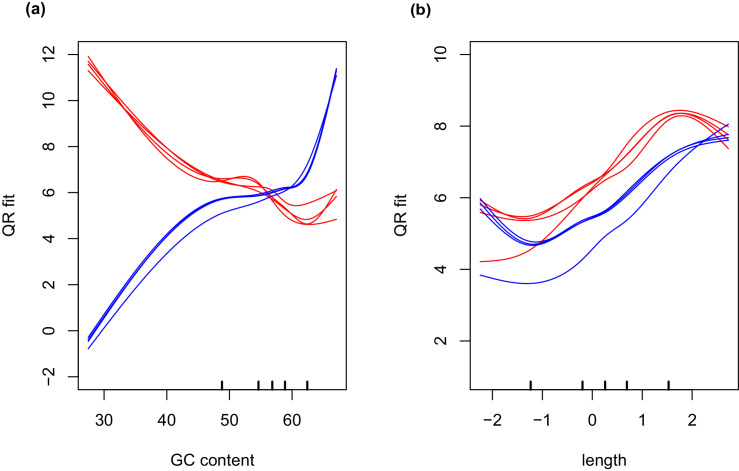
Figure 7. GC and transcript length bias in SMARTer-cDNA synthesis-Nextera-XT libraries compared to TrueSeq libraries.
Red lines indicate the GC content or transcript length biases in reads obtained from SMARTer-cDNA synthesis-Nextera-XT libraries. Blue lines indicate the GC content or transcript length biases in reads obtained from TrueSeq libraries. (a) GC content and length are plotted against ‘QRfit’ which is a measure of fit by quantile regression to the models in Hansen et al. (2012). This metric approximates bias in the sequence dataset by comparing read counts to expected models based on quantiles in the distribution of the GC content of the transcripts. The opposing trends in the two sets of lines shows that GC content bias between the two different libraries is vastly different. The reads obtained from SMARTer-cDNA synthesis-Nextera-XT libraries will tend to have more counts for low GC content transcripts, while the reads obtained from TrueSeq libraries will tend to have more counts for high GC content transcripts, systemically. (b) There is also some moderate transcript length bias differences between the two library prep methods visualized as the separation between the groups of red and blue lines. The methods implemented by the conditional quantile normalization (cqn) package in R handles both types of bias to make the gene count data from both library preparation methods comparable.

