. 2017 Apr 5;6:e24487. doi: 10.7554/eLife.24487

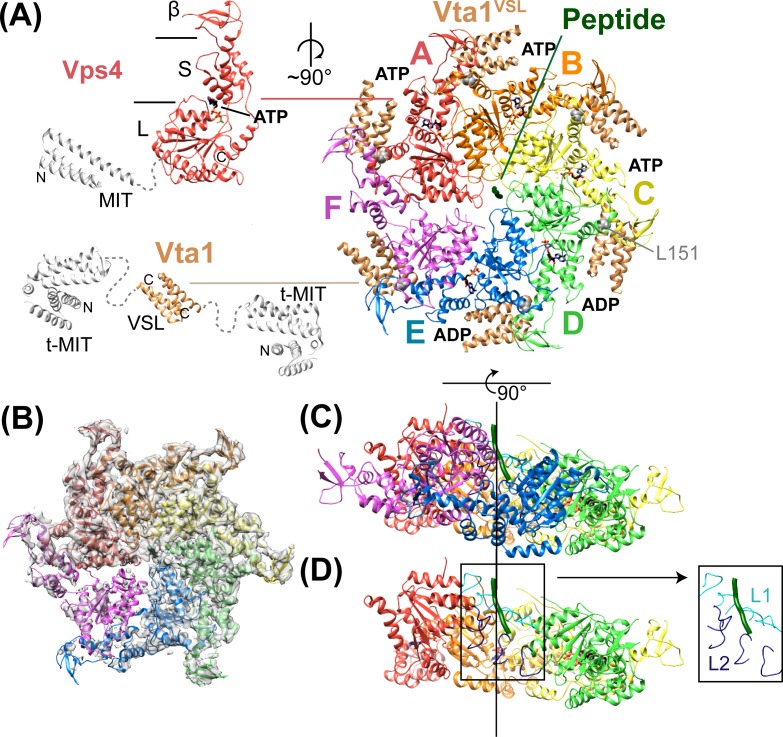
Figure 2. Structure of Vps4101-437:Vta1VSL:ESCRT-IIIpeptide:ADP·BeFx.

(A) Structure of the complex. The Vps4 and Vta1 constructs used for cryo-EM structure determination are shown in color on the left, with excluded segments colored white. MIT, large AAA ATPase (L), small AAA ATPase (S) and β domains of Vps4 are labeled, as are the t-MIT and VSL domains of the Vta1 dimer. L151, a residue critical for hexamerization, is shown in gray spheres. (B) 4.3 Å map with the Vps4 model. (C) Side view of Vps4 hexamer, oriented with the subunit A-D helix axis vertical (black line). (D) Same as panel D but with subunits E and F removed. The inset shows the position of pore loops 1 (L1, residues 203–210, cyan) and pore loops 2 (L2, 240–248, dark blue) relative to the ESCRT-III peptide (dark green).

DOI: http://dx.doi.org/10.7554/eLife.24487.007

Figure 2.

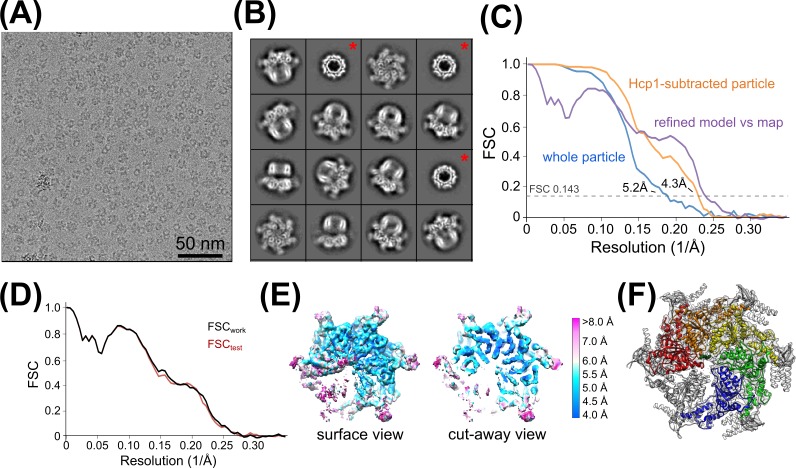
Figure 2—figure supplement 1. Vps4 3D reconstruction, refinement, and validation.

Figure 2—figure supplement 1.

(A) Representative cryo-EM image of Vps4101-437-Hcp1 particles. (B) Representative 2D class averages of Vps4101-437-Hcp1 particles. Red asterisks indicate classes with disordered Vps4 in which only the Hcp1 template is apparent. (C) ‘Gold standard’ FSC curves generated by RELION before (blue) and after (orange) Hcp1 signal subtraction. The FSC curve of the refined model (comprising the large and small AAA ATPase domains of subunits A-E and substrate peptide) against the final Hcp1-subtracted Vps4 map is shown in purple. (D) Cross-validation of the refined model. The refined model (comprising large and small AAA ATPase domains of subunits A-E and the substrate peptide) was randomly displaced by applying 0.5 Å shifts to all atoms and refined against one of the half maps generated by RELION. FSC curves are shown between the re-refined model against the half map used for re-refinement (FSCwork, black) and between the re-refined model and the other half map (FSCtest, red). The agreement between the two FSC curves is an indicator that the model has not been overfit. (E) Local resolution estimates determined by ResMap. (F) The composite model indicating the refined portions of Vps4 (colored ribbons) and other regions limited to rigid body fitting (Vps4 β domains, subunit F, and Vta1VSL, gray ribbons). Same orientation as panel (E). Note that Vta1 densities are weak prior to 3D classification (see Figure 2—figure supplement 6).

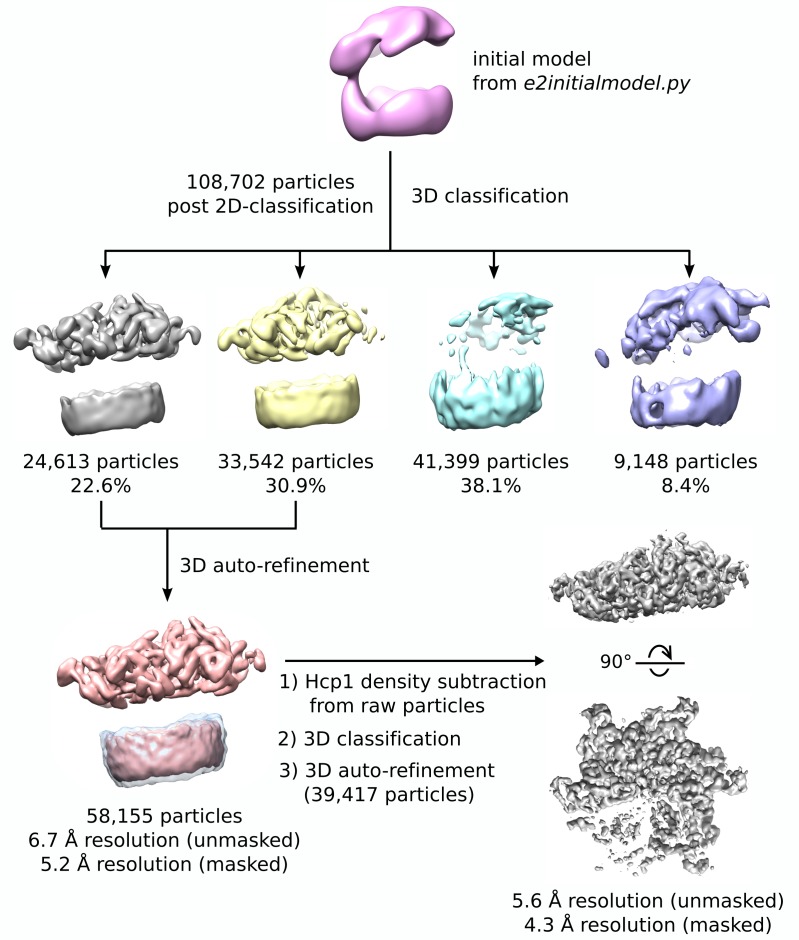
Figure 2—figure supplement 2. 3D reconstruction workflow.

Figure 2—figure supplement 2.

Flow chart depicting classification and refinement of Vps4 particles. An initial model was generated from a gallery of non-CTF corrected 2D class averages, which was then used as a starting point for 3D classification. Particles from two classes showed ordered Vps4 features, which were then used to compute a 6.7 Å resolution consensus structure. Hcp1 densities were subtracted from raw images, followed by an additional round of RELION 3D classification and auto-refinement, which produced the final 4.3 Å resolution reconstruction.

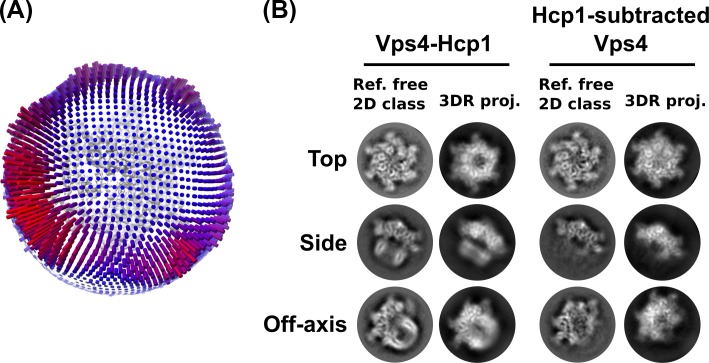
Figure 2—figure supplement 3. Additional validation of the 3D reconstruction.

Figure 2—figure supplement 3.

(A) Angular distribution plot based on RELION assignments and visualized in UCSF Chimera. (B) Comparison between reference-free 2D class averages and re-projections of the 3D reconstructions of the Vps4101-437-Hcp1 particle and Hcp1-subtracted Vps4 particle.

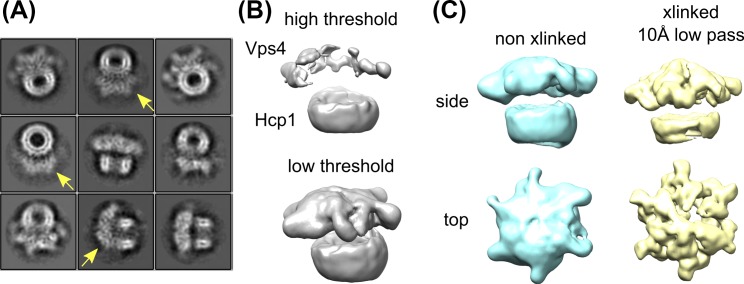
Figure 2—figure supplement 4. Glutaraldehyde crosslinking improves the Vps4 density without distorting the structure.

Figure 2—figure supplement 4.

(A) Reference-free 2D class averages of non-crosslinked Vps4101-437-Hcp1 particles. Note that the Vps4 features are weaker and smeared out (yellow arrows) relative to the Hcp1 template and relative to the crosslinked sample (Figure 2—figure supplement 1). (B) 3D reconstruction of non-crosslinked Vps4101-437-Hcp1 particles reveals the Vps4 hexamer only at very low thresholds. (C) Comparison between non-crosslinked (cyan) versus crosslinked particles (yellow) reveal consistent features.

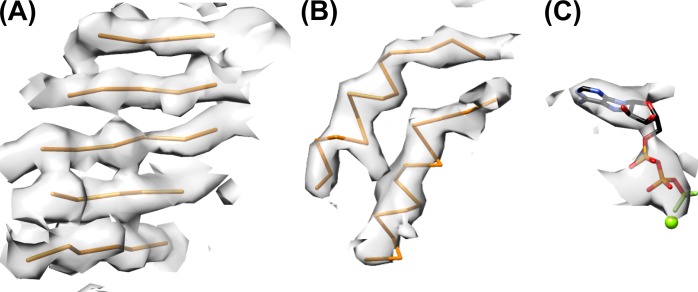
Figure 2—figure supplement 5. Refined model and representative density.

Figure 2—figure supplement 5.

(A) Central β-sheet of subunit B with density. (B) Helices of subunit B. (C) Nucleotide density with ADP·BeFx and magnesium ion bound to subunit B.

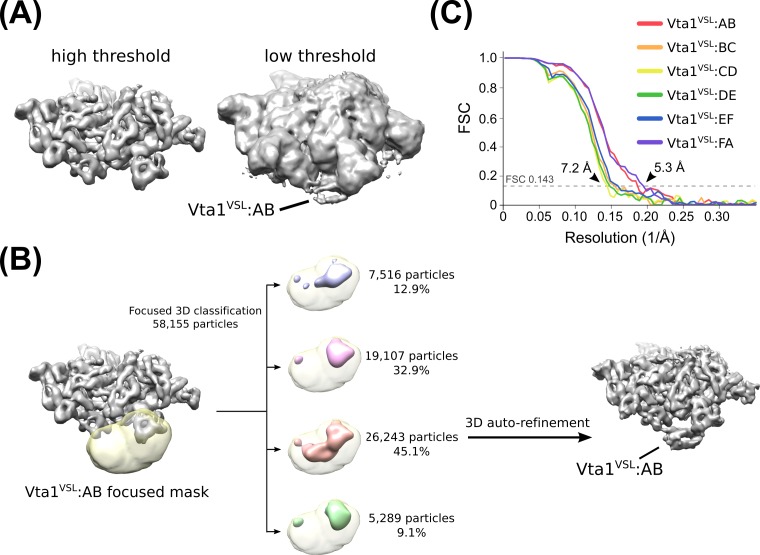
Figure 2—figure supplement 6. Identification and classification of Vta1 density.

Figure 2—figure supplement 6.

(A) Vta1VSL densities are visible at low threshold levels in an overall Hcp1-subtracted map. This observation prompted us to perform focused 3D classification with a mask over the expected Vta1 binding site. (B) Flow chart depicting 3D classification of the consensus structure with a focused mask (yellow) at the interface of subunits A and B. Classification revealed one distinct class with robust Vta1 features and the particles were isolated and subjected to an additional round of RELION auto-refinement (light red). The same strategy was employed for each interface. (C) ‘Gold standard’ FSC plots of each of the six Vta1VSL datasets derived from focused 3D classification.

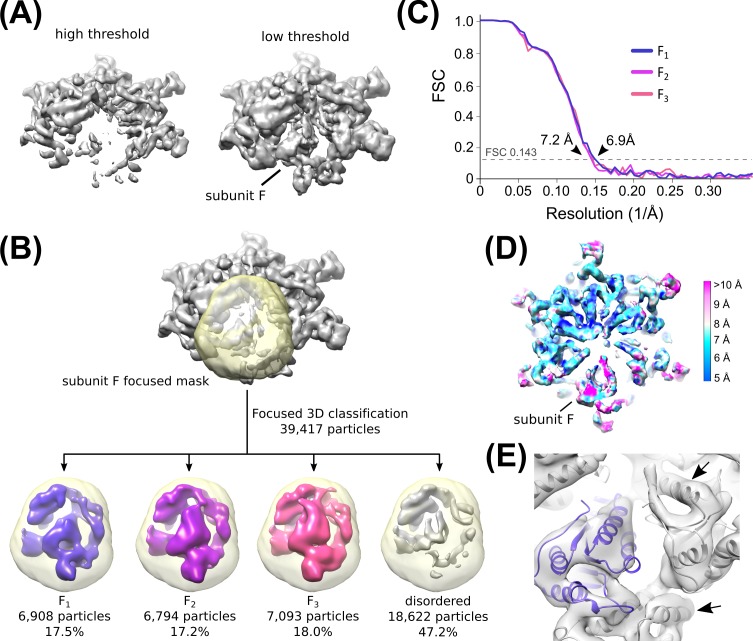
Figure 2—figure supplement 7. Classification of subunit F Density.

Figure 2—figure supplement 7.

(A) Subunit F is poorly resolved but visible at low threshold levels in an overall Hcp1-subtracted map. This prompted us to perform focused 3D classification with a mask over subunit F. (B) Flow chart depicting 3D classification of the consensus structure with a focused mask (yellow) over subunit F. Classification revealed three distinct classes that could accommodate a rigid-body fit of the Vps4 crystal structure. See Figure 2—figure supplement 6 and Methods for details. (C) ‘Gold standard’ FSC plots of the three subunit F datasets derived from focused 3D classification. (D) Cut-away view depicting the local resolution of the F1 map determined by ResMap. Note that despite the overall ~7 Å resolution of the map, subunit F itself is less well resolved. (E) Fitting of Vps4 coordinates into the F1 structure confirms that our map resolves individual helices for Vps4 subunits A-E (arrows), despite the lower resolution density for subunit F (blue).

Figure 2—figure supplement 8. Rigid-body fitting of Vps4 subunit F.

Figure 2—figure supplement 8.

Rigid-body fitting of Vps4 subunit F (colored ribbon) into three different density maps from focused 3D classification. The three models are related by pivoting of up to 16° about a point near the contact with Vta1VSL, close to the small AAA ATPase and β domains.