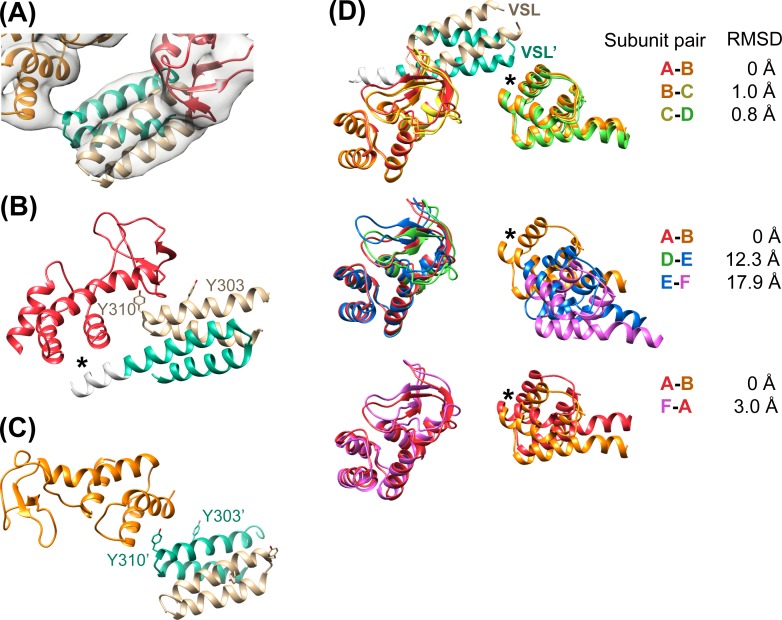
Figure 4. Vta1VSL contacts with Vps4.
(A) Density for the most clearly defined Vta1VSL (bound to the Vps4 subunit A β domain). The Vta1VSL subunits are colored tan and teal. (B) Vta1VSL interaction with the first Vps4 subunit. This interface is modeled identically to a crystal structure of Vta1VSL in complex with a truncated Vps4 construct (Yang and Hurley, 2010). Additional N-terminal residues in the longer Vta1 construct used in this study are shown in white and their interaction with the small AAA ATPase domain of Vps4 is indicated with an asterisk. (C) Vta1VSL interaction with the second Vps4 subunit. Y303’ and Y310’ are labeled. (D) Overlap of subunit pairs on the small AAA ATPase domain of the first Vps4 (residues 301–349 and 403–411). Consequent RMSD values are shown for residues 300–311 and 320–331 of the second Vps4 subunit at the second Vta1 interface (asterisk).


