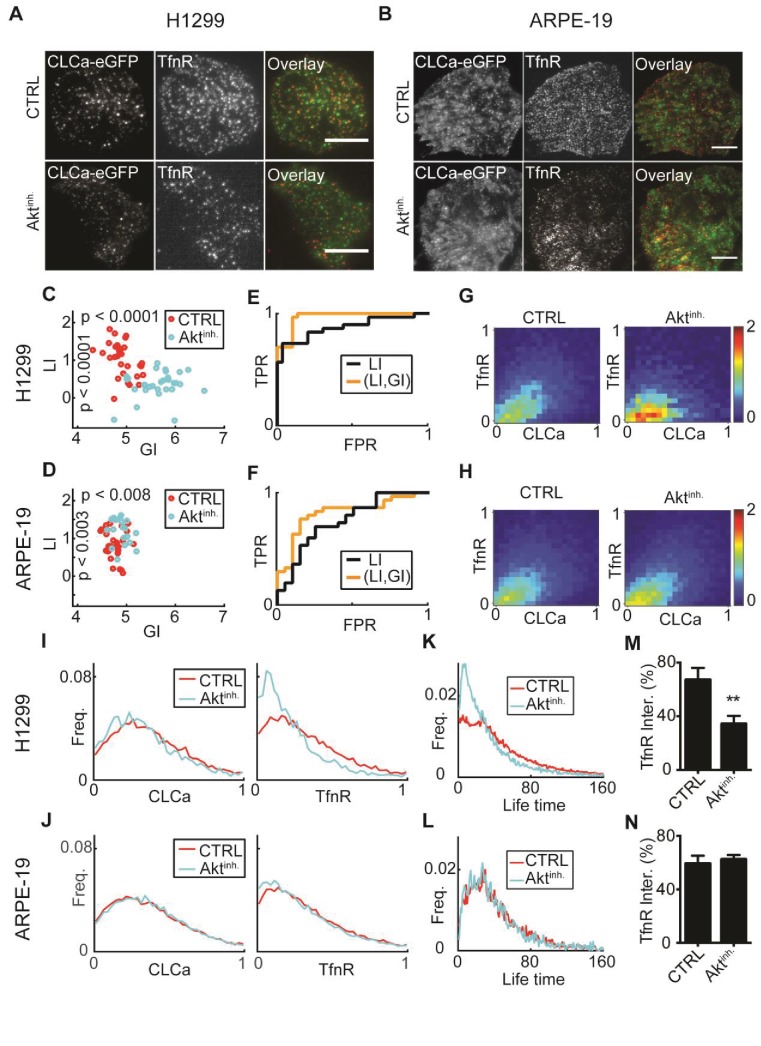
Figure 6. : AKT inhibition differentially alters recruitment of TfnR to CCPs during CME for different cell lines.
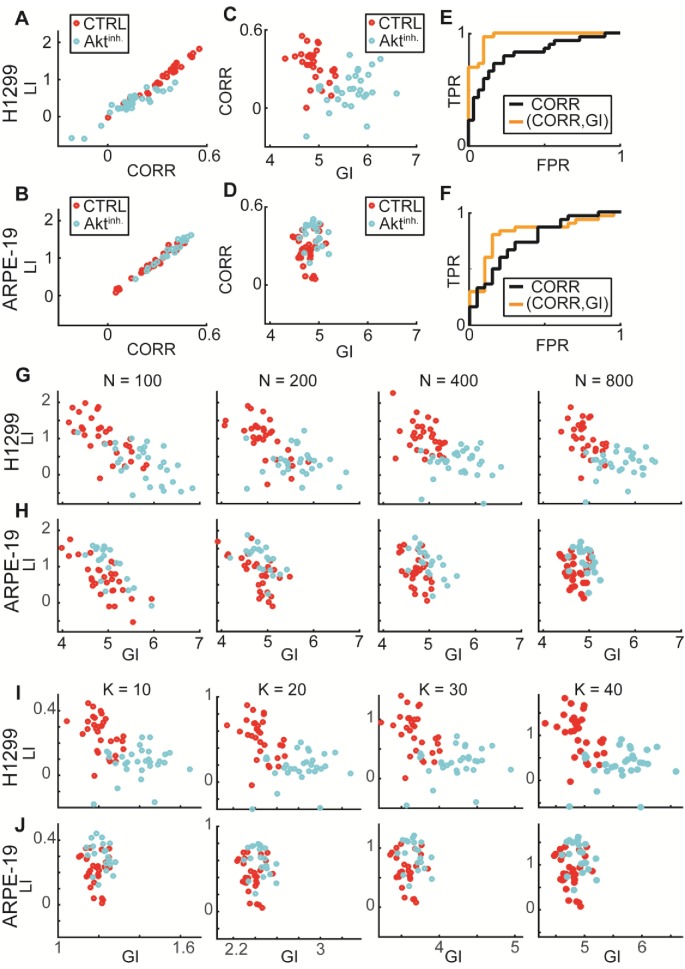
(A) H1299 cells expressing CLCa and TfnR ligands. Top row, representative WT cell (TfnR ligand, GI = 4.6, LI = 1.6). Bottom row, representative AKT-inhibited cell (TfnR ligand, GI = 6.0, LI = 0.3). Scale bar 10 μm. (B) ARPE-19 cells. Top row, representative WT cell (TfnR ligand, GI = 4.3, LI = 0.8). Bottom row, representative AKT-inhibited cell (TfnR ligand, GI = 4.6, LI = 1.6). (C–D) LI and GI of CLCa-TfnR co-localization for Ctrl (red) and Aktinh. cells (cyan). Every data point represents the LI and GI values for a single cell. Statistical analyses performed with the Wilcoxon rank-sum test. All DeBias analyses were performed with K = 40. (C) H1299: N number of cells Ctrl = 30, Aktinh. = 30; number of CCPs per cell: Ctrl = 455.5, Aktinh. = 179.5. GI p-value < 0.0001, LI p-value < 0.0001. (D) ARPE-19: N number of cells Ctrl = 30, Aktinh. = 20; number of CCPs per cell: Ctrl = 958.8, Aktinh. = 1138.2. GI p-value < 0.002, LI p-value < 0.008. (E–F) Receiver Operating Characteristic (ROC) curves showing the true positive rates as a function of false-positive rates for single cell classification, higher curves correspond to enhanced discrimination (Materials and methods). Black – LI, orange – (GI,LI). Statistics via permutation test (Materials and methods). (E) H1299 AUC: (GI,LI) = 0.96 versus LI = 0.88, p-value ≤ 0.003. (F) ARPE-19 AUC: (GI,LI) = 0.83 versus LI = 0.72, p-value ≤ 0.048. (G–H) Joint distributions of CLCa (x-axis) and TfnR (y-axis) for H1299 (G) and ARPE-19 (H) cells. (I–J) Marginal distributions of CLCa (left) and TfnR (right) for H1299 (I) and ARPE-19 (J) cells. (K–L) Combined CCP lifetime distribution for 50 Ctrl (red) and Aktinh. (cyan) cells. Statistics with Wilcoxon rank-sum test (Materials and methods). (K) H1299: p-value < 0.006 (mean EMD: Ctrl = 29.3 versus Aktinh. = 43.6); number of cells: 50 (Ctrl), 11 (Aktinh.). (L) H1299: p-value n.s. (mean EMD: Ctrl = 36.1 versus Aktinh. = 38.0); number of cells: 12 (Ctrl), 12 (Aktinh.). (M–N) Percentage of TfnR uptake: Ctrl versus Aktinh. (whiskers - standard deviation). Statistics via two-tailed Student’s t-test. (M) H1299: p-value < 0.005; N = 3 independent experiments. (N) ARPE-19: p-value n.s.; N = 3 independent experiments.


