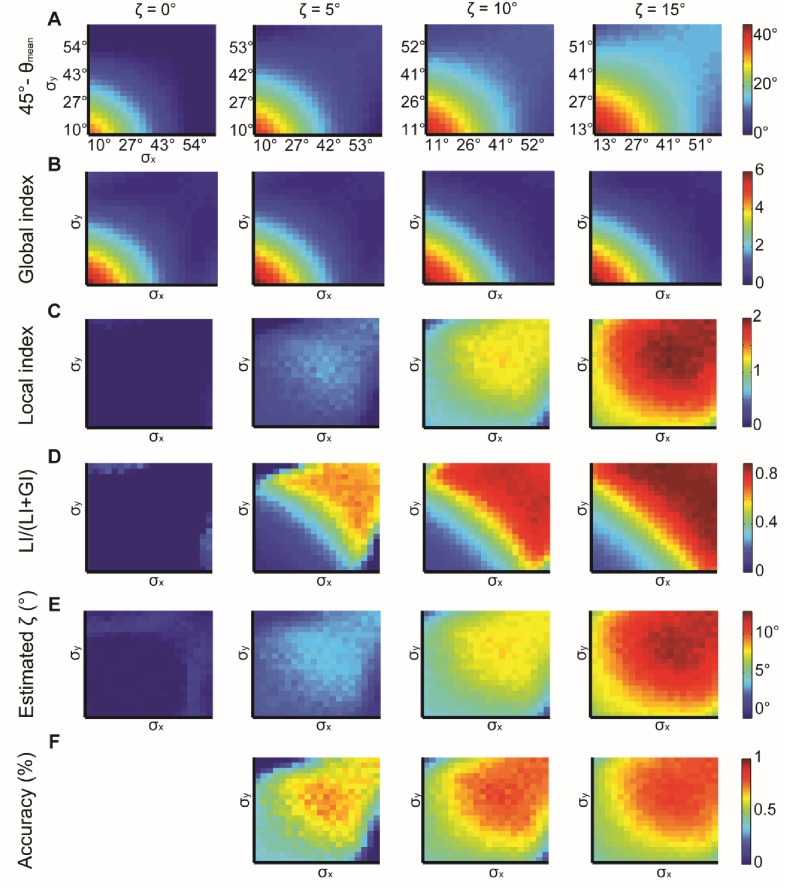
Appendix 2—figure 1. Simulations for X, Y normal distributions with different x, y and constant ζ = 0°, 5°, 10°, 15°.
(A) 45° – θmean reflecting the cumulative effect of the global bias and the local interaction between X, Y (θmean is the mean observed alignment). Lower variance and higher correspond to better alignment. (B) Global index. has a small effect on GI. (C) Local index. has a major effect on LI. (D) Relative contribution of LI to the observed alignment increases as function of ζ. (E) Retrieved estimated calculated as the relative contribution of LI to the observed alignment (panel D) times the cumulative effect of the global bias and the local interaction (panel A). (F) Accuracy of estimated grows with and with lower x, y. Note, that this estimation is a lower bound for the true (Appendix 1, Theorem 4). Accuracy cannot be measured for = 0° hence the empty panel.

