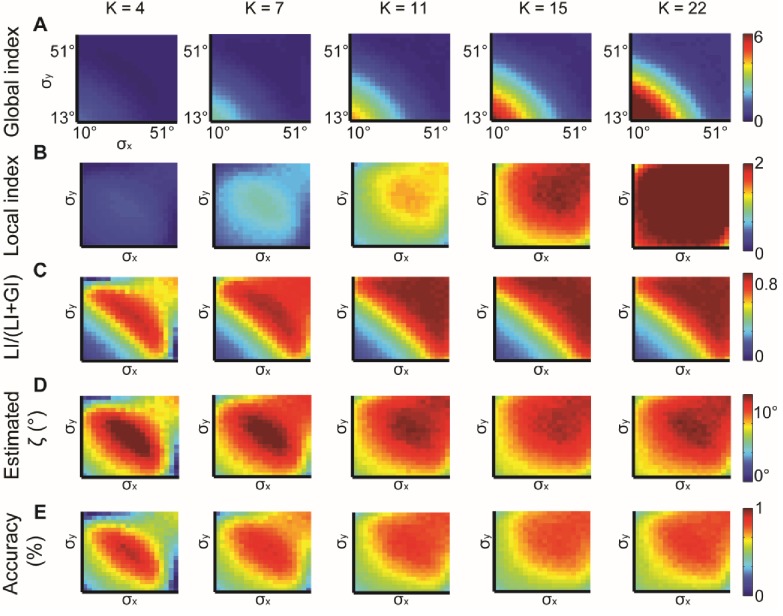
Appendix 2—figure 2. Simulations for different values of K, the number of bins in the alignment distribution.
normal distributions with different and constant ζ = 15°. K = 4, 7, 11, 15, 22 were examined. (A–B) Global (A) and local (B) indices grow with K. (C–E) Relative contribution of LI to the observed alignment (C), Retrieved estimated (D) and accuracy of estimated (E) stabilizes for K ≥ 11.

