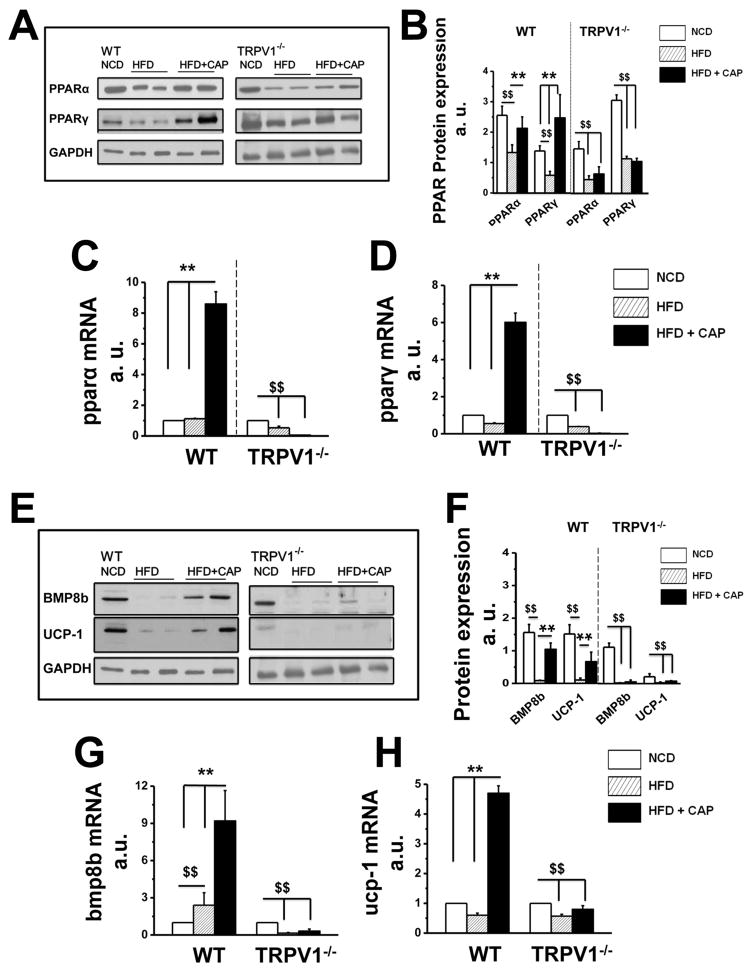
Figure 2. CAP increases PPARs and thermogenic BMP8b and UCP-1 in BAT of WT but not TRPV1−/− mice.
A. PPARα and PPARγ expression in BAT obtained from NCD or HFD (± CAP)-fed WT and TRPV1−/− mice. B. Mean PPAR proteins expression intensity ± S.E.M normalized to GAPDH (loading control) for n = 5 independent experiments. The average mRNA levels ± S.E.M of pparα (C) and pparγ (D) normalized to NCD are given for NCD, HFD or HFD + CAP-fed WT and TRPV1−/− mice. E. BMP8b and UCP-1 expression in BAT obtained from NCD or HFD (± CAP)-fed WT and TRPV1−/− mice. F. BMP8b and UCP-1 protein expression mean band intensities ± S.E.M normalized to the loading control GAPDH for 5 independent experiments. The mean mRNA levels ± S.E.M of bmp8b (G) and ucp-1 (H) normalized to NCD are given for NCD, HFD or HFD + CAP-fed WT and TRPV1−/− mice. For quantitative RT-PCR experiments, 18S ribosomal RNA was used as control. $$ and ** represent statistical significance for P<0.05.

