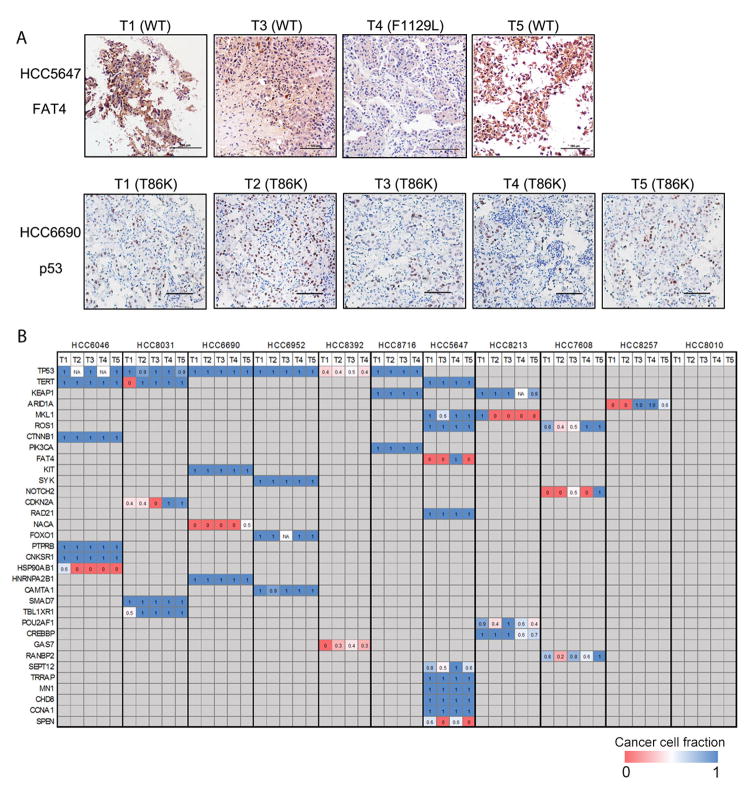
Figure 2. Spatial heterogeneity and CCF of putative driver mutations in HCC.
(A) IHC staining of FAT4 and p53 in different tumor regions which have been profiled by M-WES. Mutational status is indicated on top of each region. Scale bars, 100 μm. WT, wildtype. (B) Heat map of the CCF of putative driver mutations. Numeric number in each square shows the CCF. Columns, tumor regions; Rows, genes.

