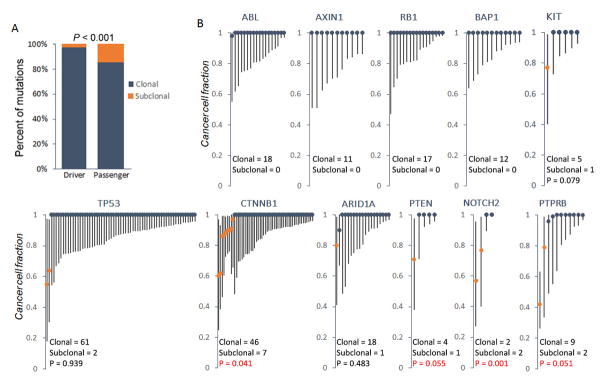
Figure 3. Clonal status of HCC driver mutations sequenced by TCGA.
(A) The proportion of clonal and subclonal mutations in both driver and passenger events. (B) CCF analysis of mutations in representative driver genes from TCGA HCC dataset. Each line represents an individual mutation. Round dot, upper and lower end of each line represents CCF, upper and lower bound of confidence interval, respectively. Clonal and subclonal CCF are shown as dark blue and orange, respectively. Driver genes were identified using MutSig algorithm (28) on the basis of the TCGA data (FDR q < 0.1). P values were derived by hypergeometric tests comparing the frequency of subclonal mutations in each gene against that in all driver genes. In those genes without any subclonal mutations, P value was not calculated.

