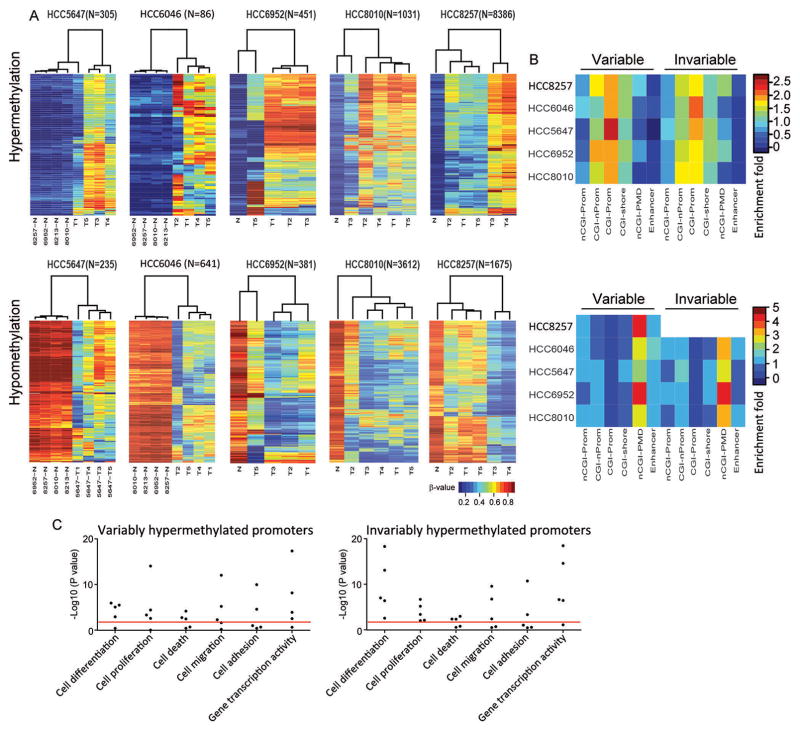
Figure 5. Epigenetic intratumoral heterogeneity in HCC.
(A) Unsupervised hierarchical clustering of intratumoral methylation profiling of five HCC cases. Rows of the heat maps denote the methylation levels of variably hypermethylated (upper panel) or hypomethylated (upper panel) CpG sites across different tumor regions. Columns represent samples. (B) Enrichment plots showing the distribution of both variably and invariably hypermethylated (upper panel) or hypomethylated (lower panel) CpG sites across a variety of functional genomic domains. nCGI-Prom (non CG island Promoter); CGI-nProm, (CG islands not in promoter regions); CGI-Prom, CG island promoters; nCGI-PMD, PMD excluding CGI probes. All P values of hypergeometric enrichment test (comparing the frequency of each variable and invariable probe set category to that of array background) were shown in the Supplementary Table 6. (C) Dot plots displaying enriched GO biological processes for the genes associated with variably and invariably hypermethylated promoters, with each dot representing one individual case. Red line indicates P value of 0.01.

