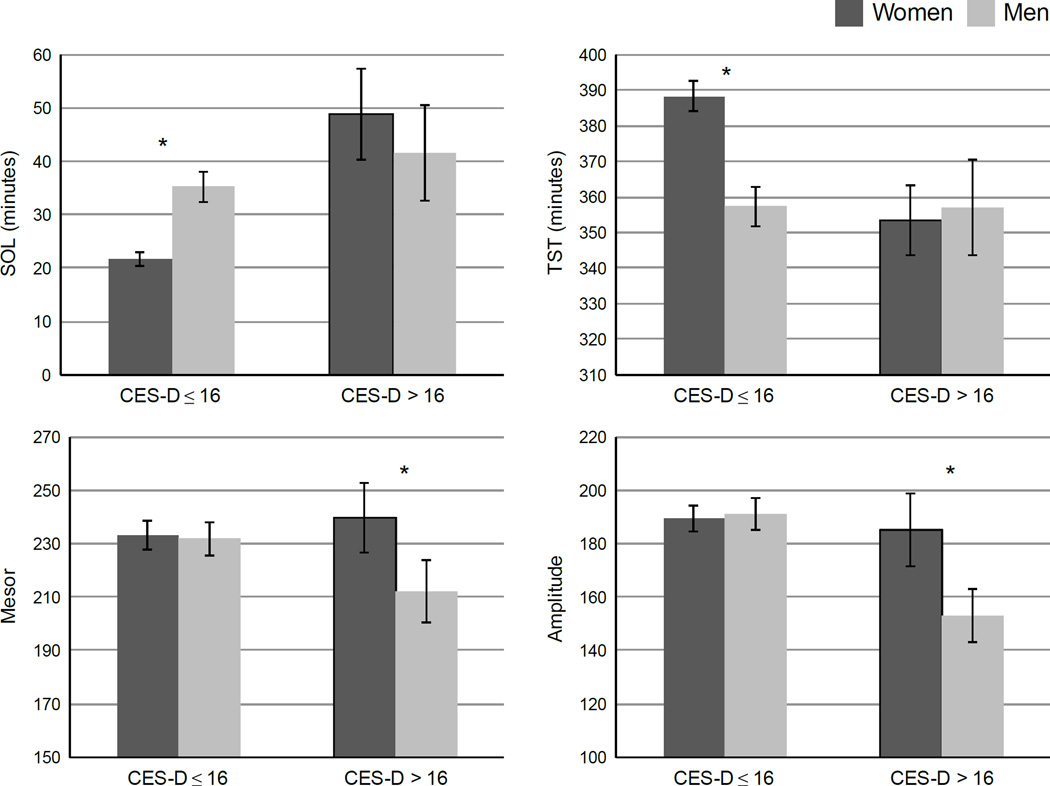
Figure 1.
Sex moderates the relationships between depression and SOL, TST, mesor (mean activity level), and amplitude (height of the rest-activity rhythm). SOL = Sleep Onset Latency, TST = Total Sleep Time. * indicates statistically significant contrast. Error bars represent the standard error of the mean. Women with CES-D ≤ 16 (n = 212), mean CES-D score = 6.2 (SD = 4.6); Women with CES-D > 16 (n = 40), mean CES-D = 24.2 (SD = 6.6); Men with CES-D ≤ 16 (n = 137), mean CES = 6.0 (SD = 4.7); Men with CES-D > 16 (n = 29), mean CES-D = 24.0 (SD = 7.4).

